Tableau ServiceNow integration is the ultimate solution for organizations seeking to elevate their advanced analytics and reporting endeavors, aiming to extract maximum value from their data reservoirs while enhancing decision-making prowess. This tactical integration between two powerful independent platforms gives users critical data visualization capabilities and management solutions.
This article will answer why Tableau is such a crucial element for ServiceNow advanced reporting; we will delve into its key features and benefits and talk about the Tableau ServiceNow Connector. Furthermore, we will discuss the best practices to get the most from Tableau ServiceNow integration.
- The Case for Adopting Professional BI Tools for Advanced ServiceNow Reporting
- Introducing Tableau: Empowering Advanced Reporting for ServiceNow
- Tableau Compared: Advantages for ServiceNow Reporting
- Connecting Tableau to ServiceNow Data Sources: A Practical Guide
- Best Practices and Tips: Maximizing Tableau for ServiceNow Reporting
- Recap
The Case for Adopting Professional BI Tools for Advanced ServiceNow Reporting
ServiceNow is a cloud-based platform that helps organizations automate, manage, and optimize processes. While many organizations can use in-built ServiceNow analytics capabilities, others must perform deeper analyses than ServiceNow allows. To overcome this and other limitations (which we will cover further) and enhance reporting functionalities. ServiceNow BI integration significantly contributes to data analysis, interpretation, and presentation, which is key for strategic decision-making. By leveraging these external BI tools, organizations move beyond basic reporting functionalities, unlocking deeper insights, providing in-depth analysis, and driving organizational efficiency. External BI tools extend ServiceNow analytics by providing custom data interpretation methods and translating complex datasets into understandable and actionable information.
Challenges and Limitations of Native ServiceNow Reporting Tools
ServiceNow is a cloud-based, AI-driven platform that provides excellent ITSM, business process automation (BPA), and workflow automation solutions. Nevertheless, native ServiceNow reporting also has some limitations when we talk about reporting tools:
- Yet, ServiceNow reporting tools fall short in its analytical features, specifically in historical data tracking. Unlike other platforms that offer dynamic time-based data analysis, ServiceNow’s reporting is static, presenting only the current data snapshot without the ability to track or analyze trends over time.
- ServiceNow enables internal report sharing but doesn’t support sharing these insights with external parties. The platform allows for report exports in PDF format; however, these exports are fixed and cannot be updated in real-time, limiting their usefulness in environments where data is rapidly changing or ongoing updates are crucial.
- A notable challenge within ServiceNow’s reporting framework is the difficulty in creating a single report based on data from multiple tables and data sources within the platform itself. This limitation complicates the task for analysts who require comprehensive reporting that encompasses diverse data sets within ServiceNow.
- Moreover, when utilizing ServiceNow’s native reporting capabilities, you’re confined to analyzing solely ServiceNow data. This means that if you aim to amalgamate ServiceNow data with other data sources to gain a comprehensive overview of your organization’s performance, relying solely on ServiceNow’s in-built reporting features proves insufficient.
Introducing Tableau: Empowering Advanced Reporting for ServiceNow

Tableau is a visual analytic platform that shows data in an interactive and easily understandable helpful format, especially for users with no coding experience. It’s an excellent tool for simplifying all data visualization and providing more accurate complex data analysis. Tableau uses data of various sizes, forms, and types and translates them into appealing visual dashboards and worksheets. This complete analytics platform allows us to prepare, examine, share data insights, and build data solutions.
Tableau’s integration with ServiceNow revolutionizes how organizations approach data analysis and reporting. Through advanced data visualization techniques, Tableau allows users to extract, analyze, and visualize data from ServiceNow databases for enhanced reporting, offering a multidimensional view of the metrics and trends that matter most. This improved data extraction and analysis facilitate a more accurate understanding of the underlying data, leading to more strategic initiatives and enhanced operational efficiencies.
Furthermore, Tableau’s dynamic data handling capabilities extend to creating interactive reports and dashboards directly from ServiceNow databases. Users can customize ServiceNow dashboards to suit specific business needs, enabling them to track key performance indicators (KPIs) and identify areas for improvement in actual time. This direct integration with ServiceNow streamlines the reporting process and ensures that users have access to the latest data, fostering a more agile and responsive business environment.
Tableau Compared: Advantages for ServiceNow Reporting

Tableau is one of the most used tools of BI thanks to its multiple intuitive data visualizations, advanced reporting features, and analytics functionalities that help users see the data they need for their jobs. These features enable users across various sectors to access, interpret, and utilize essential data with greater efficiency and depth, custom-made for their professional needs.
How is Tableau different from other BI tools? It provides enhanced adaptability and more sophisticated capabilities for data visualization and analytics. Comparing Tableau vs Power BI in terms of managing large data sets, Tableau outperforms competitors. Its foundation is deeply rooted in scientific research, aiming to accelerate and simplify the analytical process, making it more user-friendly. The ability to rapidly analyze data through an iterative approach, offering instant feedback, not only makes Tableau engaging and enjoyable but also facilitates a swift and effective learning experience.
Let’s explore deeply to uncover the rationale behind Tableau’s widespread adoption and its unique value proposition in ServiceNow advanced reporting, alongside critical Tableau comparison with other BI tools.
Overview of Tableau’s Features and Benefits
Tableau, a market leader in business intelligence, streamlines data exploration and management, making insights prominent to uncover and share, significantly influencing business outcomes and broader global contexts. It offers unparalleled data clarity, converting complex datasets into understandable and actionable insights.
Key features include real-time analytics for quick decision-making, advanced forecasting for precise future projections, and intuitive presentations that communicate data effectively. Users can generate visual outputs, such as graphs, charts, and maps, to distill and communicate data effectively through increased data accessibility and transparent analytical processes. Advanced analytics capabilities such as forecasting, trend analyses, and what-if scenarios provide analysts with insightful information, letting them make crucial decisions for future planning.
Interactivity is integral to Tableau, with features like filters, tooltips, and actions inviting users to engage deeply with data. Tableau supports extensive datasets with no row limits and is engineered to process vast data efficiently, ensuring scalability and timely insights regardless of dataset size. The interactive Tableau dashboards testify to its user-centric design, offering diverse and informative visual layouts that can be easily adapted and replicated across various analytical contexts.
Comparison with Build-In ServiceNow Reporting Capabilities
Why Choose Tableau? Choosing Tableau over ServiceNow’s built-in reporting tools can significantly enhance an organization’s data visualization and analytical capabilities. While ServiceNow’s reporting capabilities are sufficient for basic needs, Tableau provides various advanced customization options and superior visualization capabilities critical for in-depth data analysis and reporting. Organizations can overcome these limitations by integrating Tableau and ServiceNow and unlocking more powerful data analysis and custom reporting functionalities. Tableau’s ability to connect with numerous data sources allows for the integration and analysis of varied data, offering significant advantages for organizations managing information across different systems.
Tableau VS Other BI Tools in the Market
Its standout features become evident when comparing Tableau to other business intelligence (BI) platforms like Power BI, Looker, and QlikView. Tableau’s ability to swiftly manage large datasets contrasts with Power BI, which may experience slowdowns under heavy data loads. This speed, coupled with Tableau’s advanced data visualization capabilities, makes it a preferred choice for many large organizations seeking deep data insights.
While Looker and Power BI are cost-effective solutions that appeal to smaller companies, Tableau offers simplicity and user-friendliness that can benefit these organizations, particularly for users without extensive IT backgrounds. Tableau comparison with QlikView, which also provides robust dashboard and reporting features, shows that Tableau has exceptional data visualization and is very user-friendly. It’s a powerful, universal tool for businesses of all sizes that can help achieve stunning visualization.
Connecting Tableau to ServiceNow Data Sources: A Practical Guide

Integrating Tableau and ServiceNow enhances the reporting and analytics capabilities by leveraging Tableau’s advanced data visualization and analytical tools. This guide outlines the steps to set up the integration using Tableau Connector for ServiceNow.
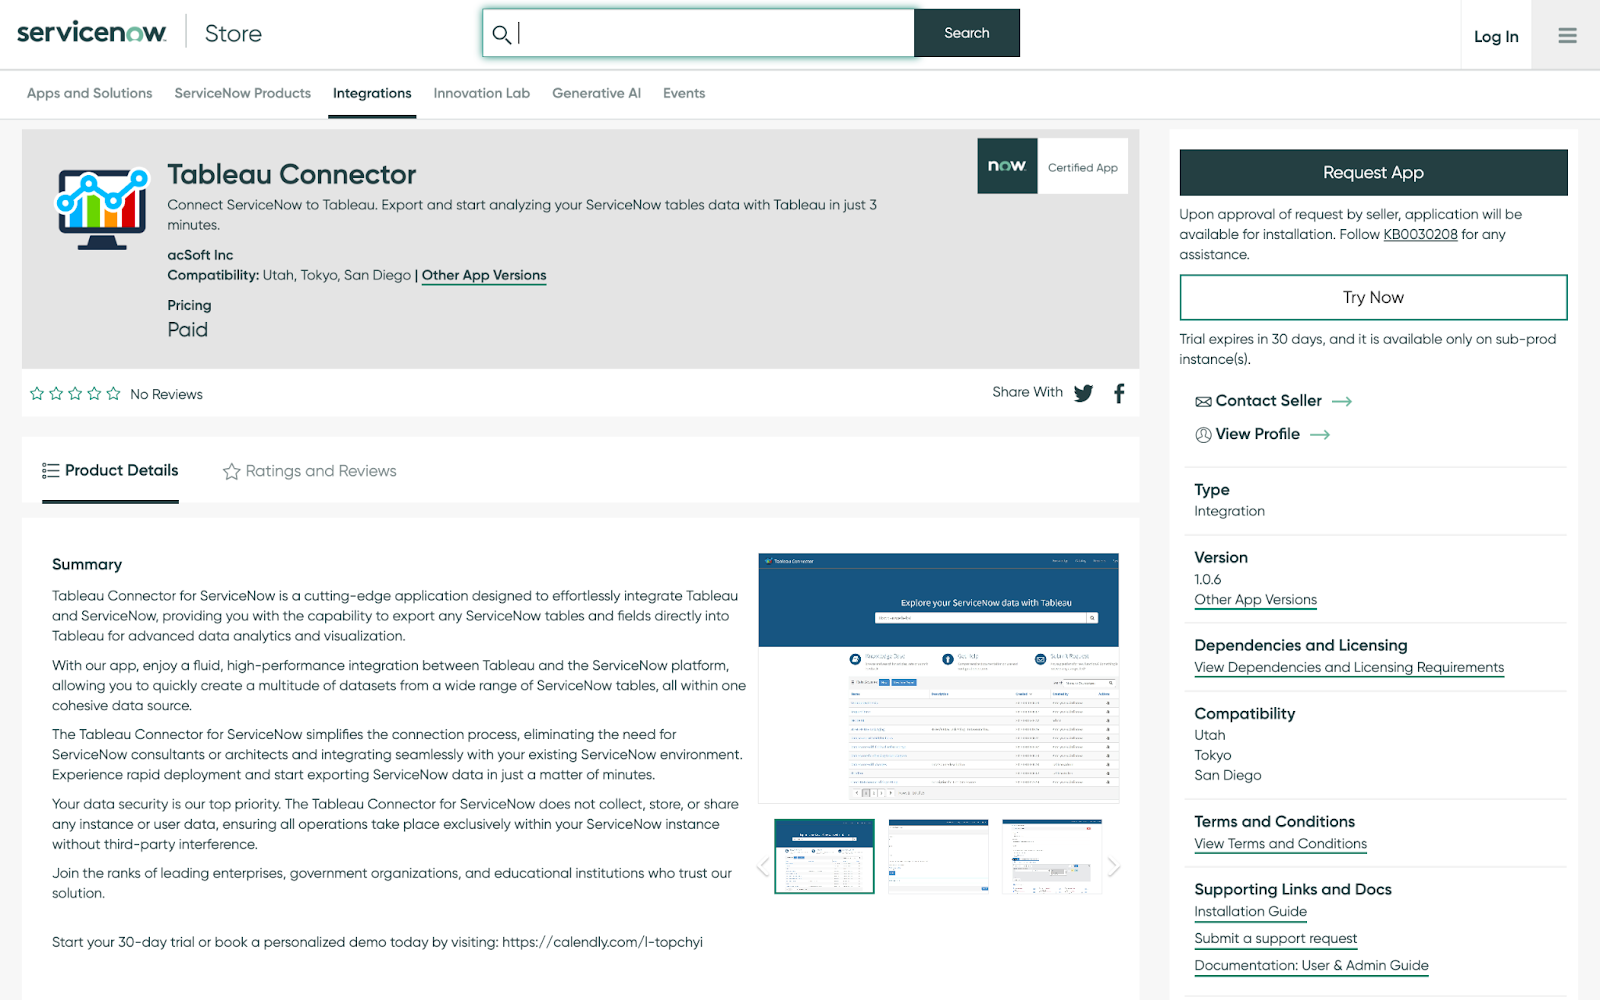
To start, you must visit the ServiceNow Store and find the Tableau Connector for ServiceNow. Access the trial version by clicking the “Try Now” button and logging in with HI credentials. It’s essential to note that users should request their ServiceNow administrator to install the trial if they lack HI credentials. The trial version is specifically available for sub-production instances and Personal Developer Instances (PDIs).
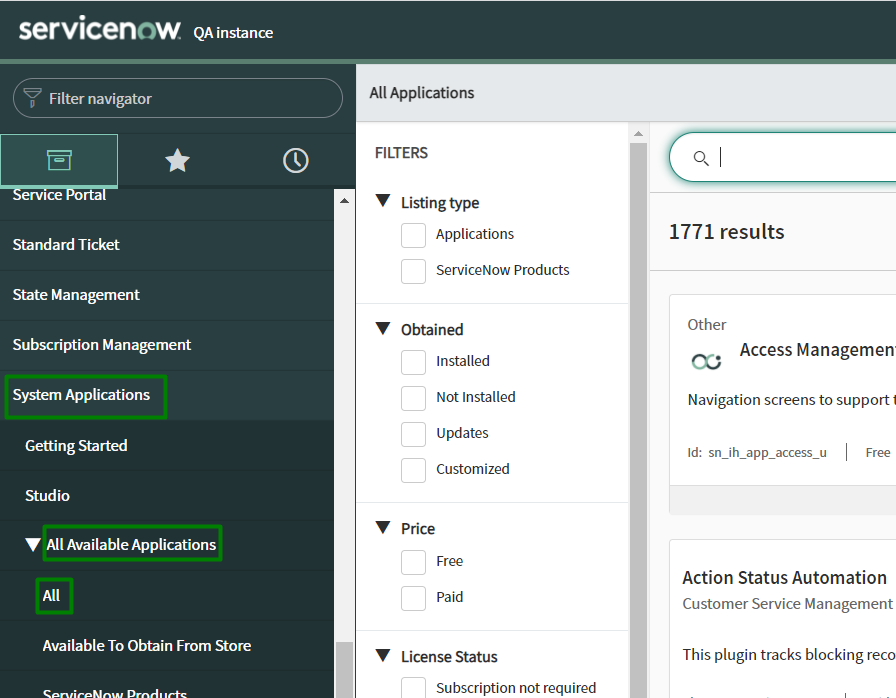
After agreeing to the Terms of Use, you can proceed with the trial by navigating through ServiceNow to System Applications > All Available Applications > All and installing the ServiceNow Tableau Connector.
Step 1: Create a Data Source in ServiceNow
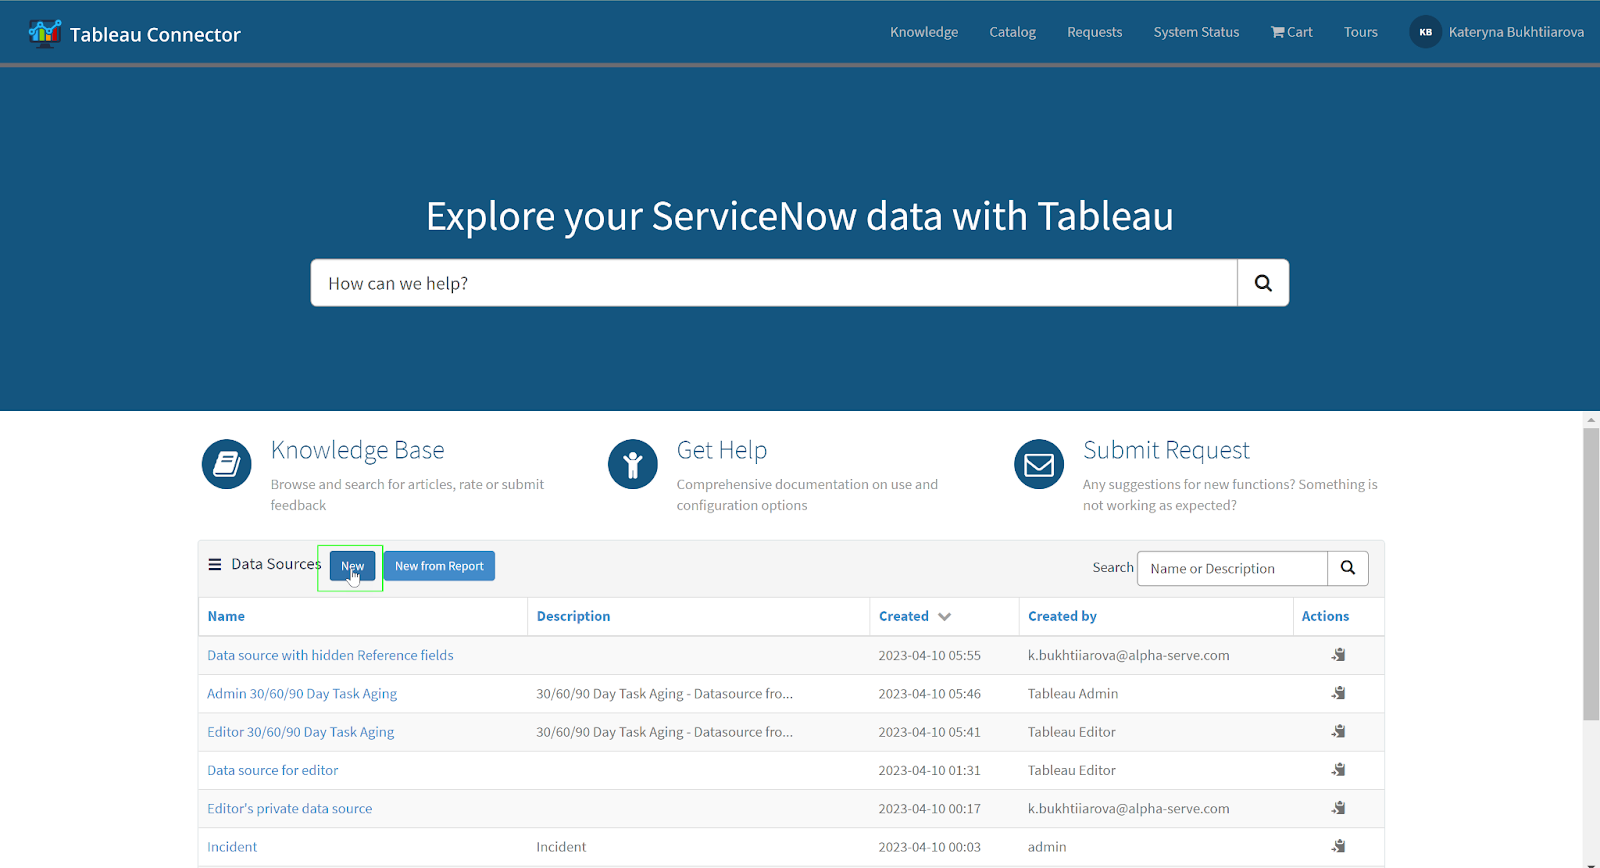
To create a data source within ServiceNow, you must possess either the TABLEAU ADMIN or TABLEAU EDITOR role. Navigate to the Data Sources section within ServiceNow and click the “New” button to create a new data source.
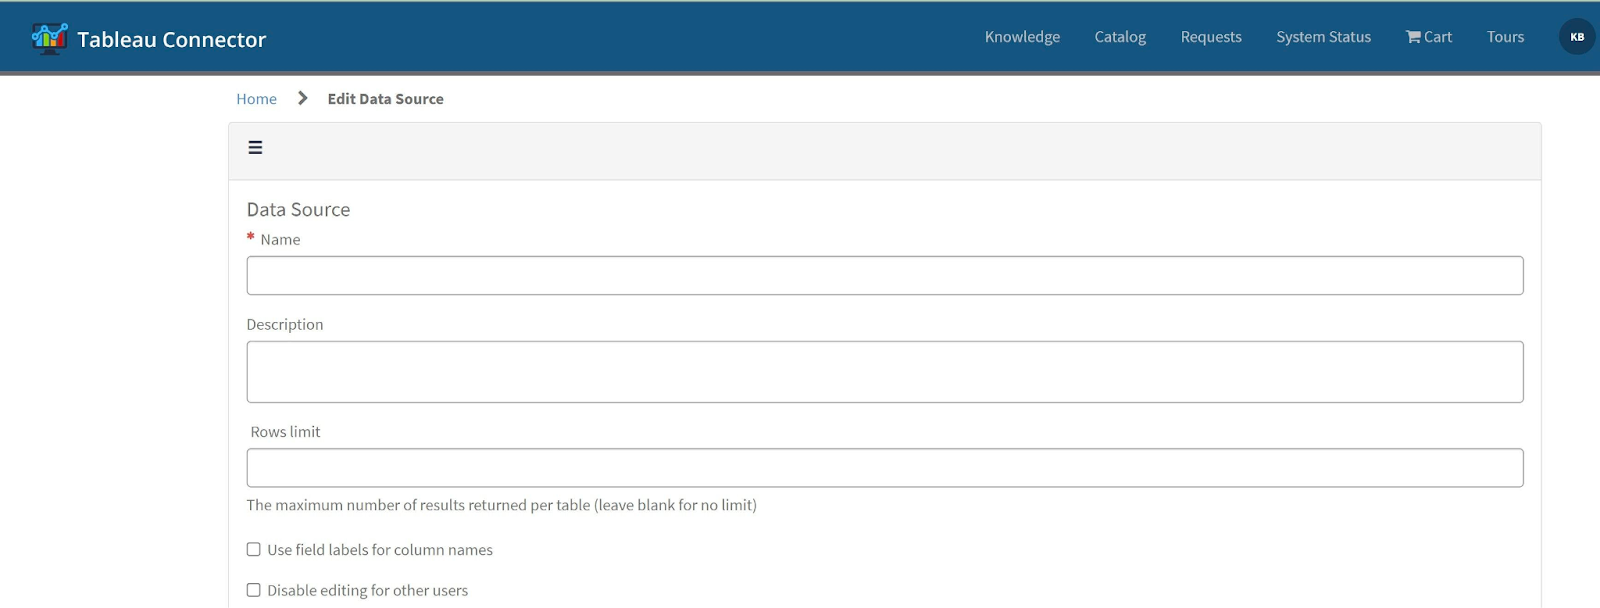
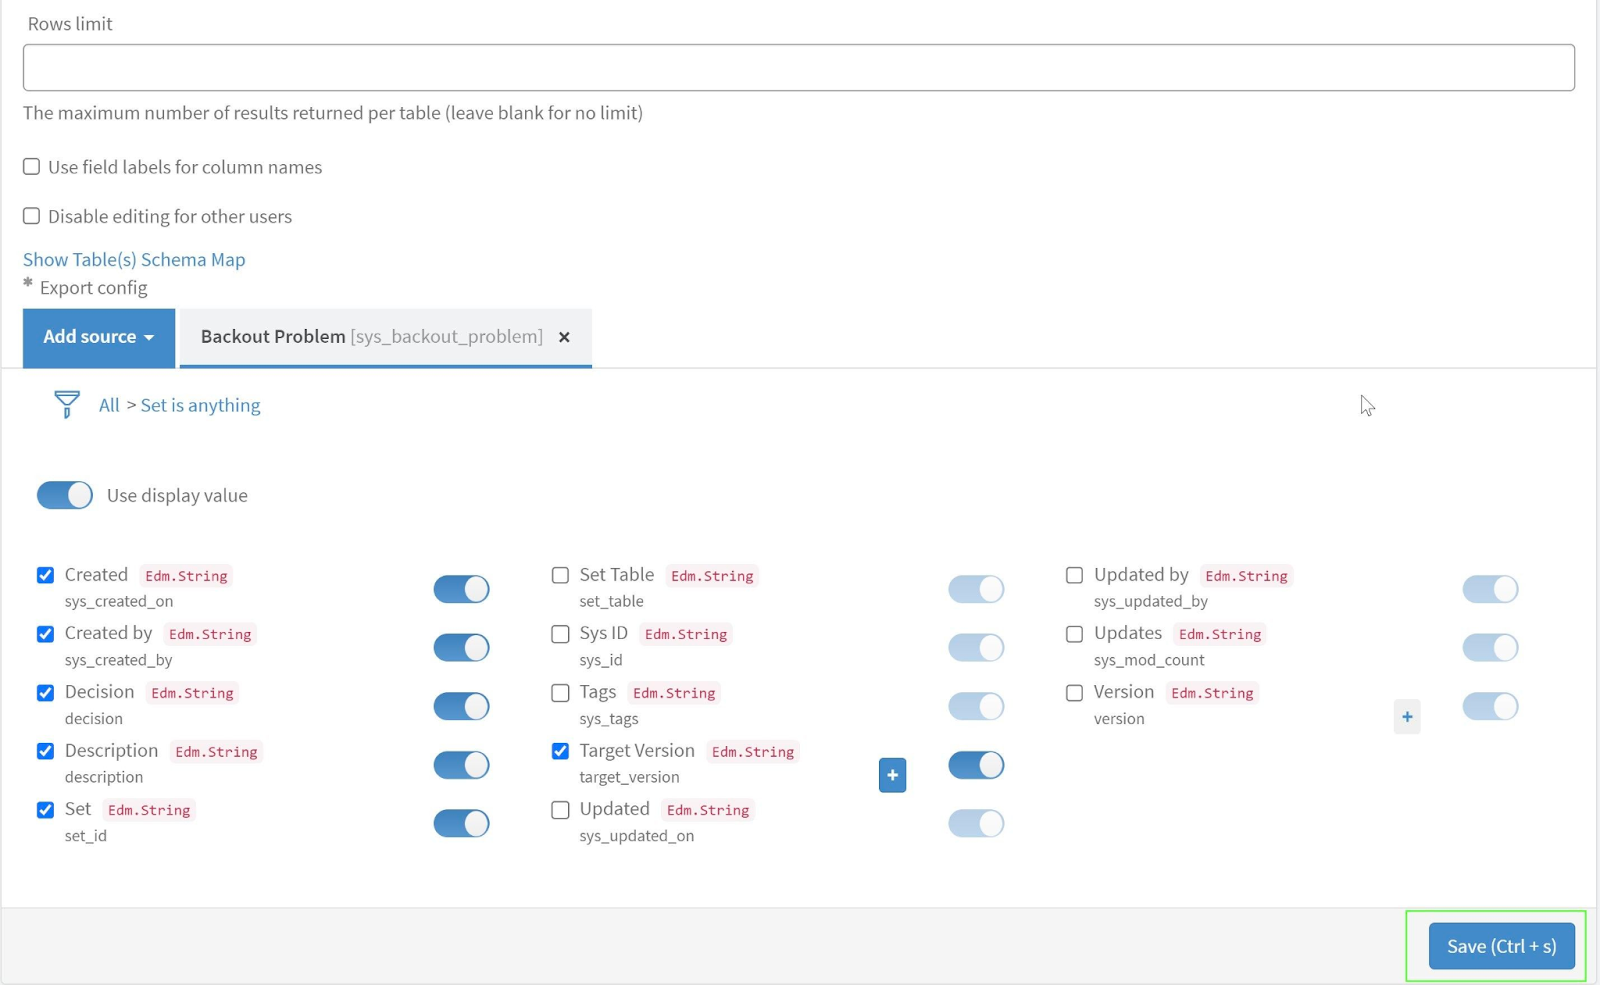
Within the ServiceNow interface, you can create a new data source by inputting necessary information, such as the data source Name and an optional Description, and setting up the Rows limit.
The data source creation also involves setting of Use field labels for column names and establishing editing permissions for data security.
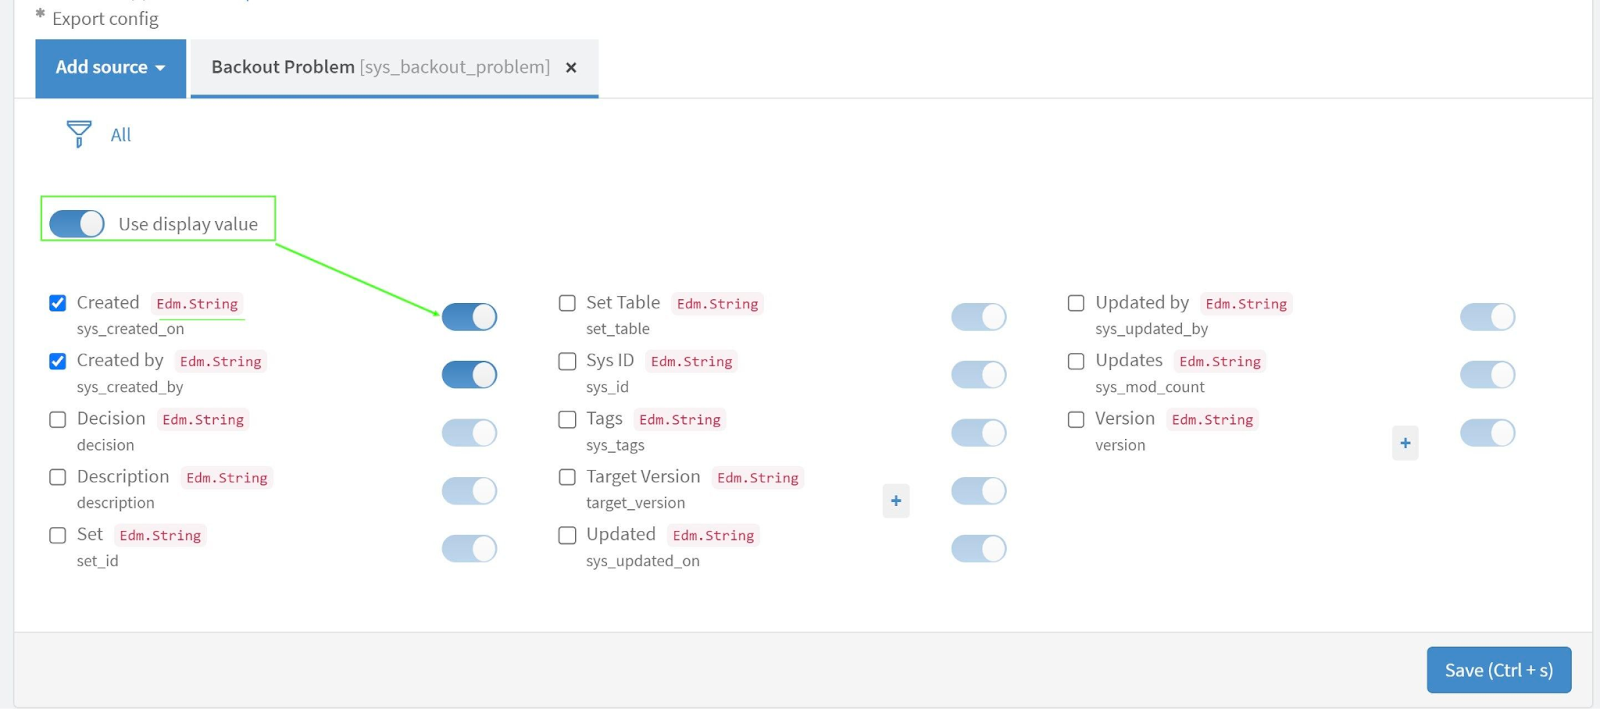
To add tables to your data source in ServiceNow, click the “Add Table” button and either type the table name in the search field or scroll through the list to find it. Once selected, click “Add” to include it in your data source. You’ll then need to choose specific fields for your reports, including all necessary tables and fields. To enhance data export, activate the “Use display value” option for string format exports.
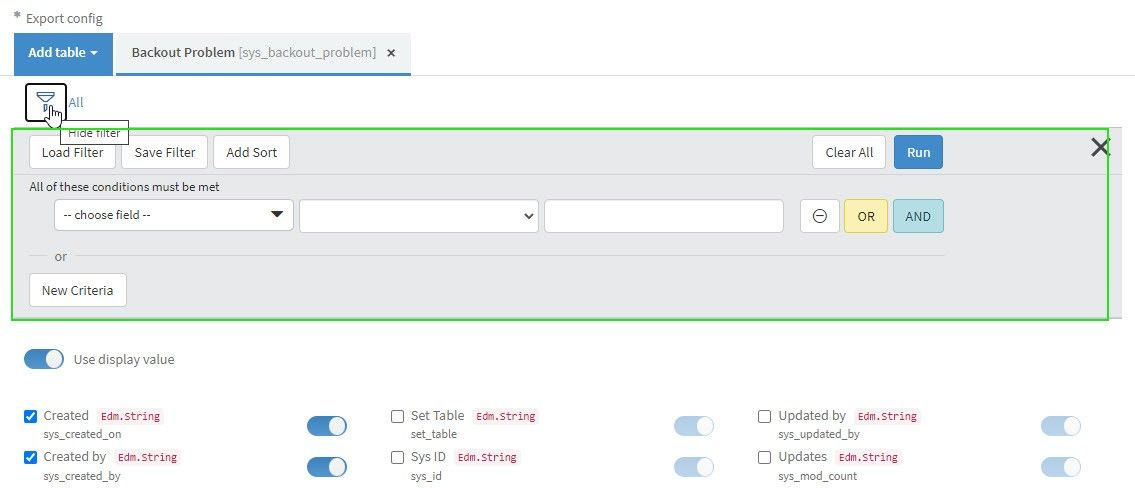
Apply filters by clicking the Filter icon, setting conditions, and executing them to refine your data.
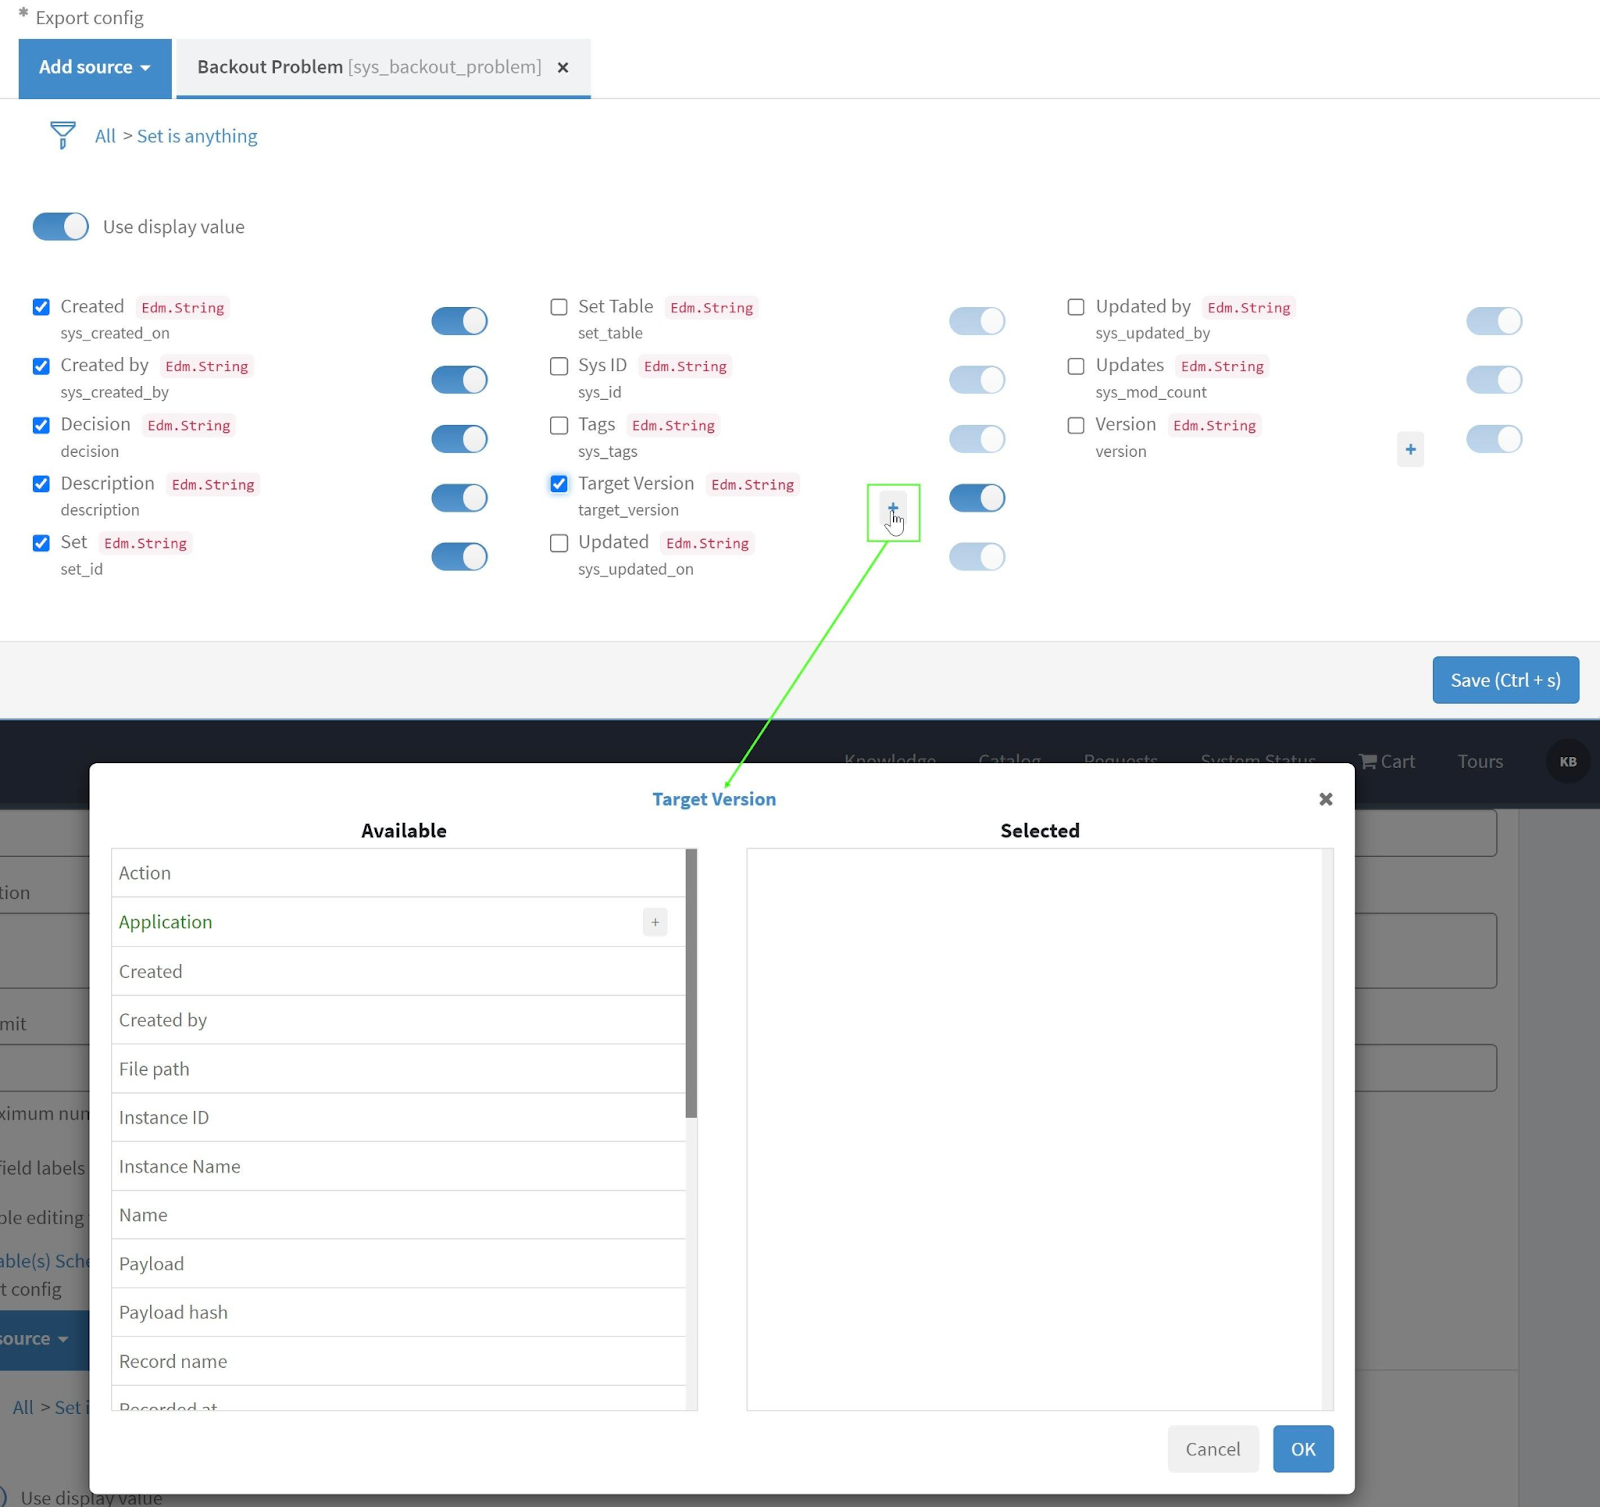
If dealing with reference-type fields, use the “+” icon to select and include these in your exports.
Remember to save your settings after configuring your data source by clicking the “Save” button.
Step 2: Export ServiceNow Data into Tableau
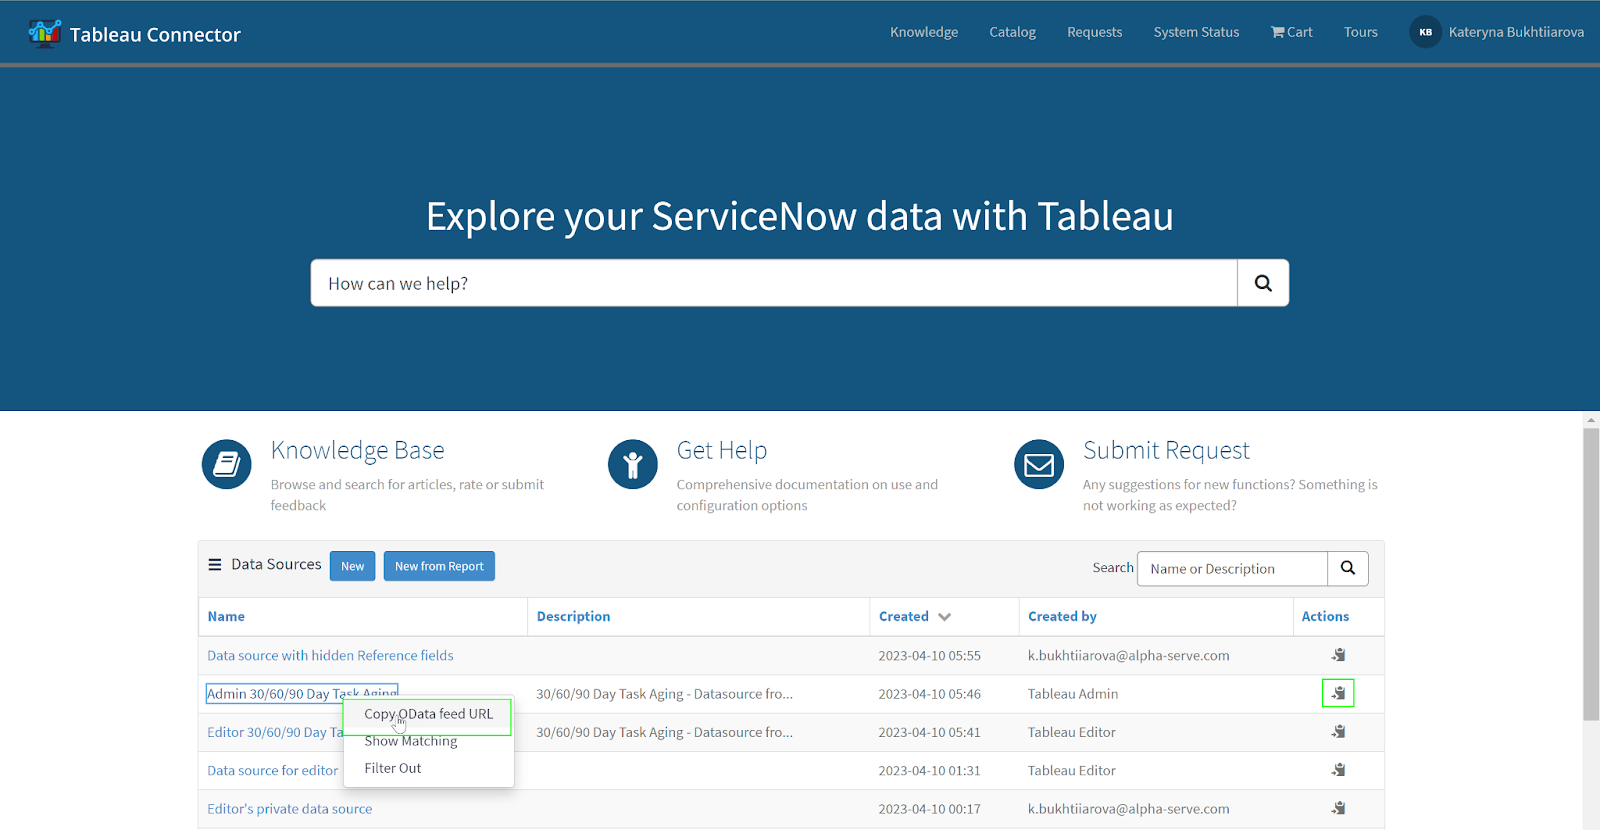
To obtain the OData feed URL for your data source, right-click on the data source to access the menu and select “Copy OData feed URL.” Alternatively, you can use the “Copy” action next to each data source listing.
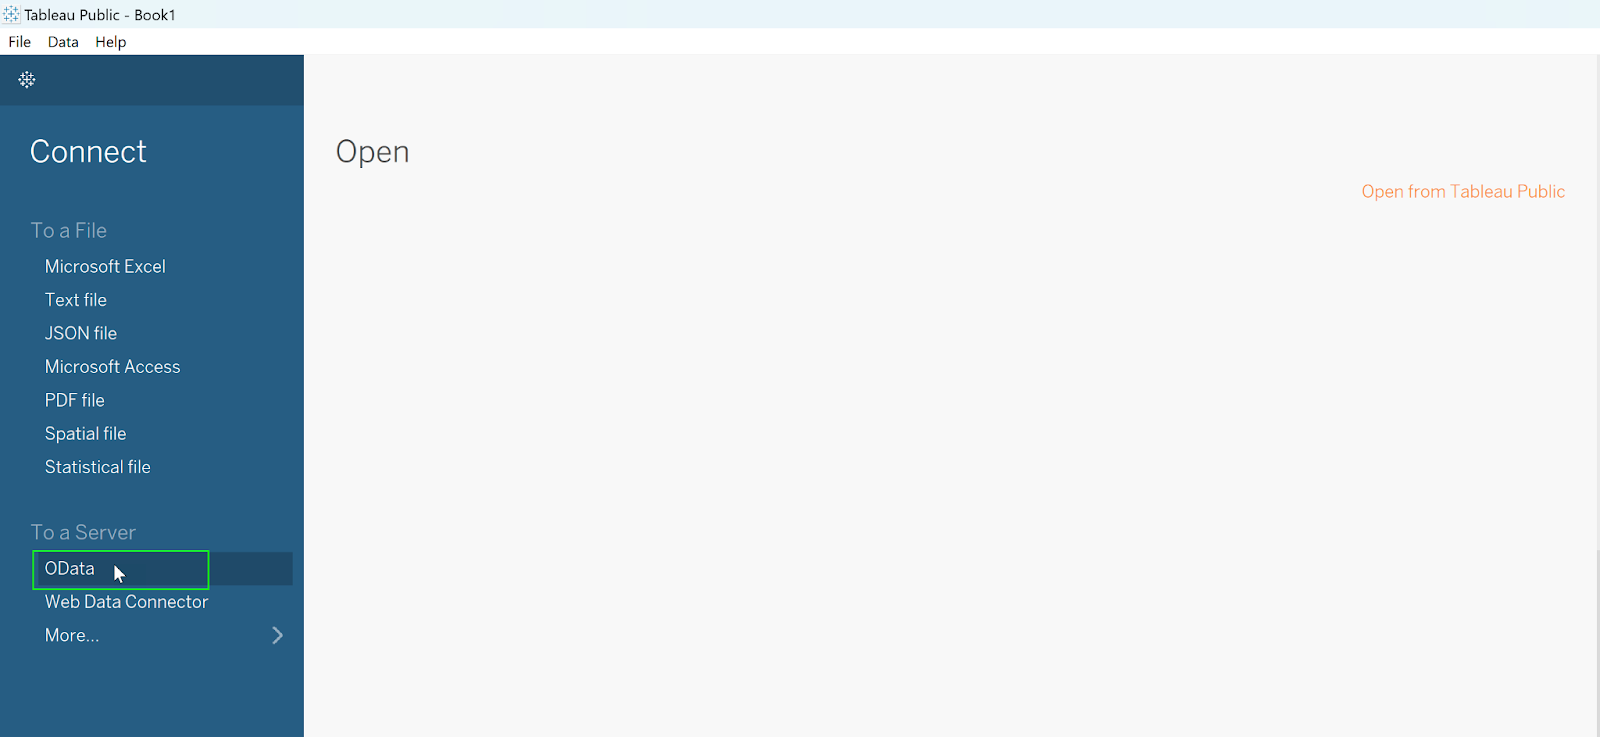
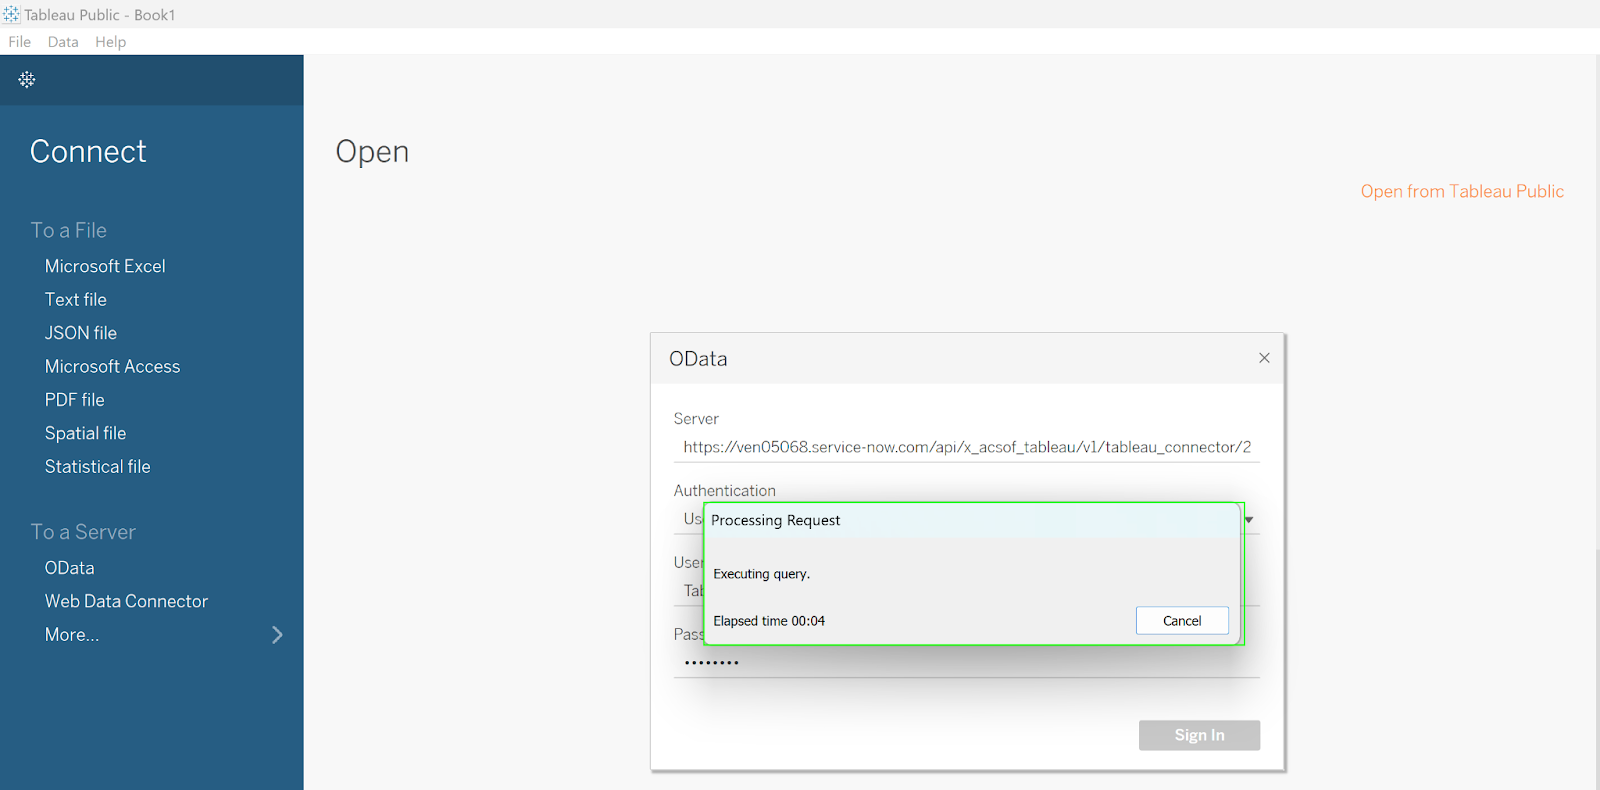
Select the OData connector in Tableau and input the OData feed URL copied from your ServiceNow data source setup.
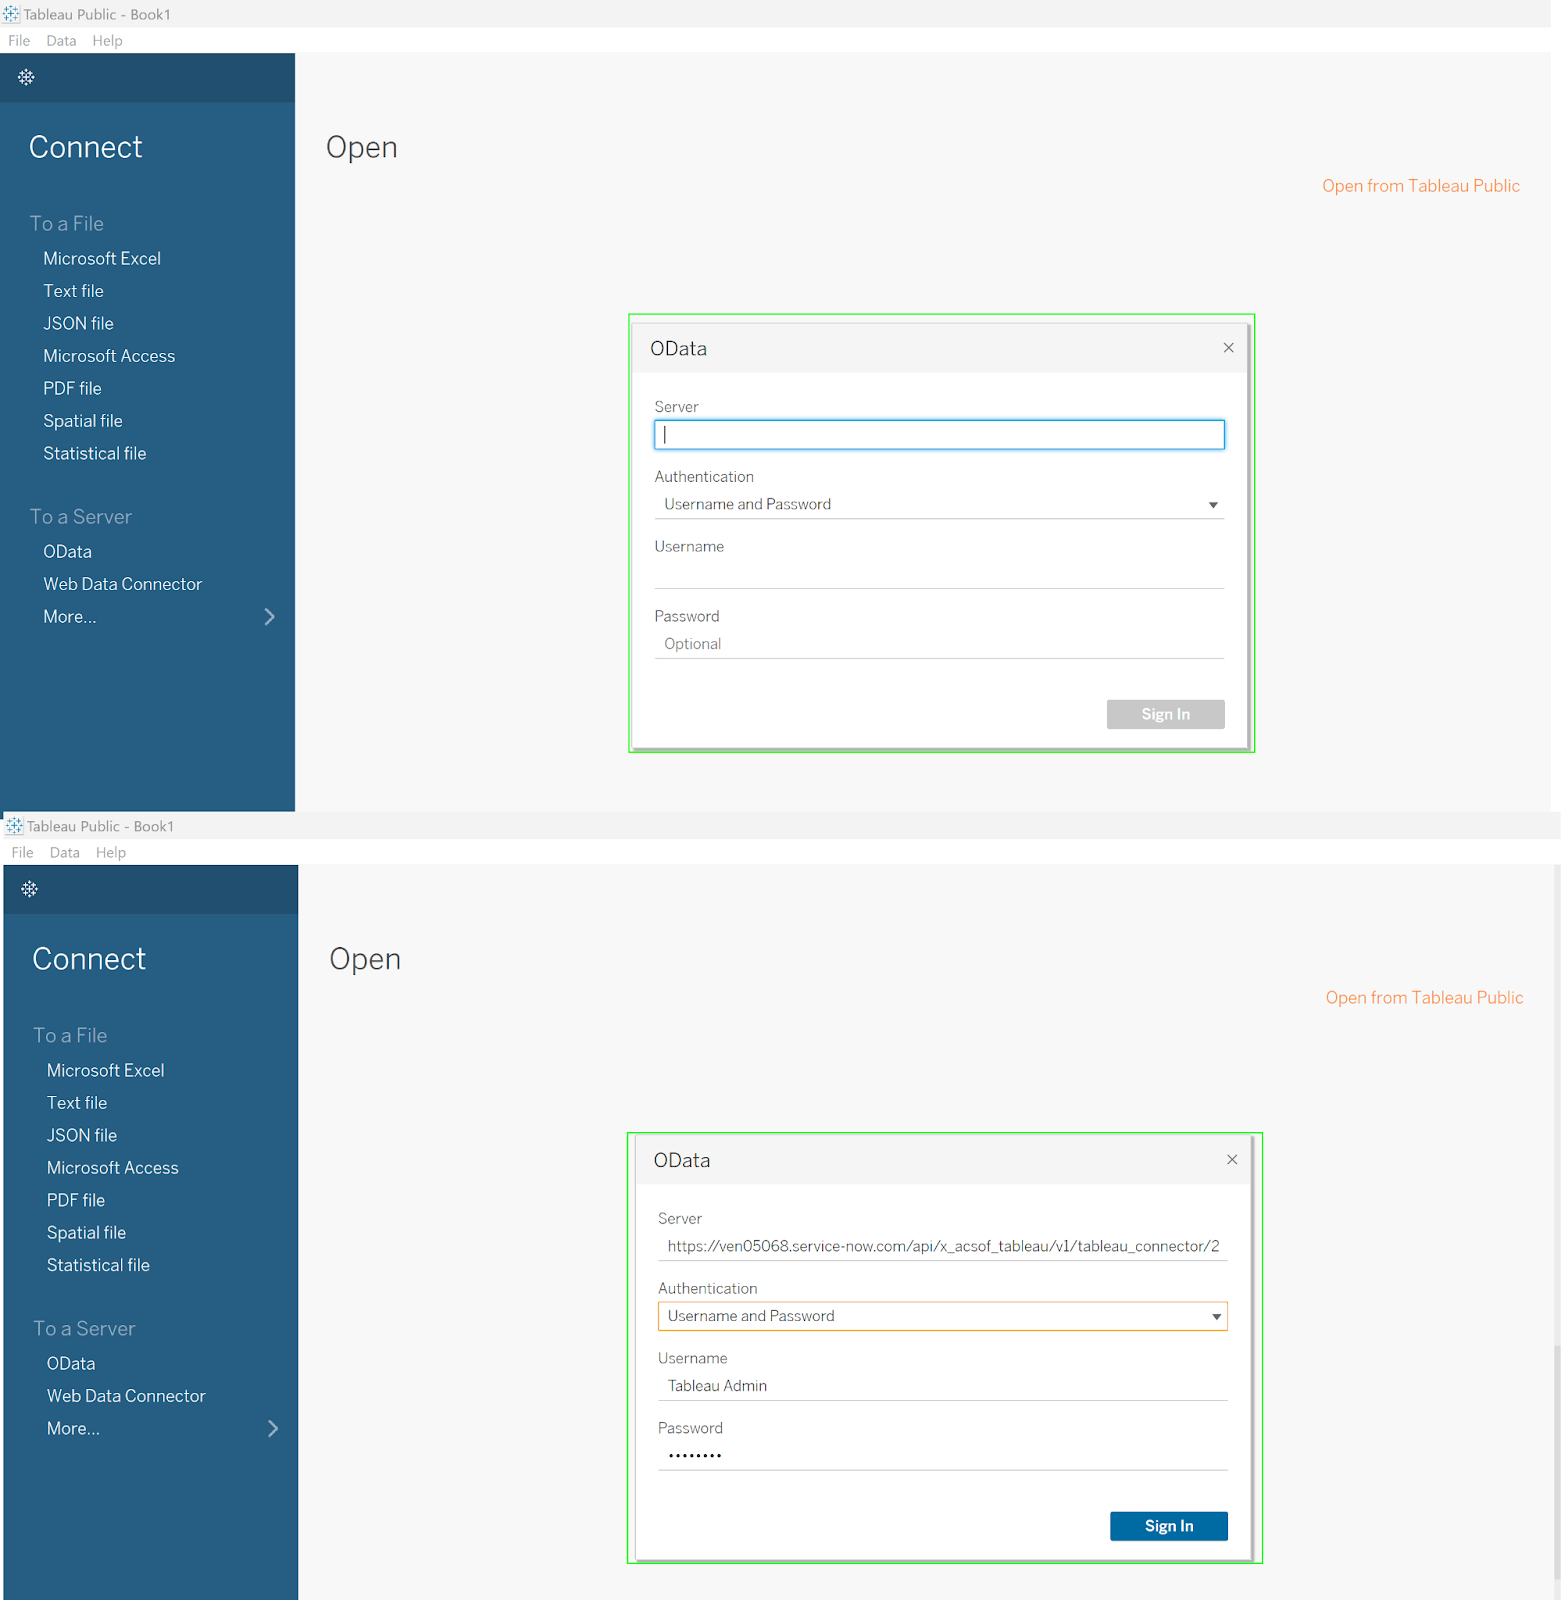
Choose “Username and Password” for the authentication type, input your credentials, and click “Sign In” to initiate the data import process.
Once the ServiceNow data export is complete, you can build Views and conduct analyses on your ServiceNow data within Tableau.
Explore our in-depth guide for step-by-step instructions on Tableau ServiceNow integration. Read our guide now and streamline your integration process effectively!
Best Practices and Tips: Maximizing Tableau for ServiceNow Reporting
The data exportation can be effortless, but users can consider the following best practices and tips to maximize Tableau and ServiceNow Reporting capabilities.
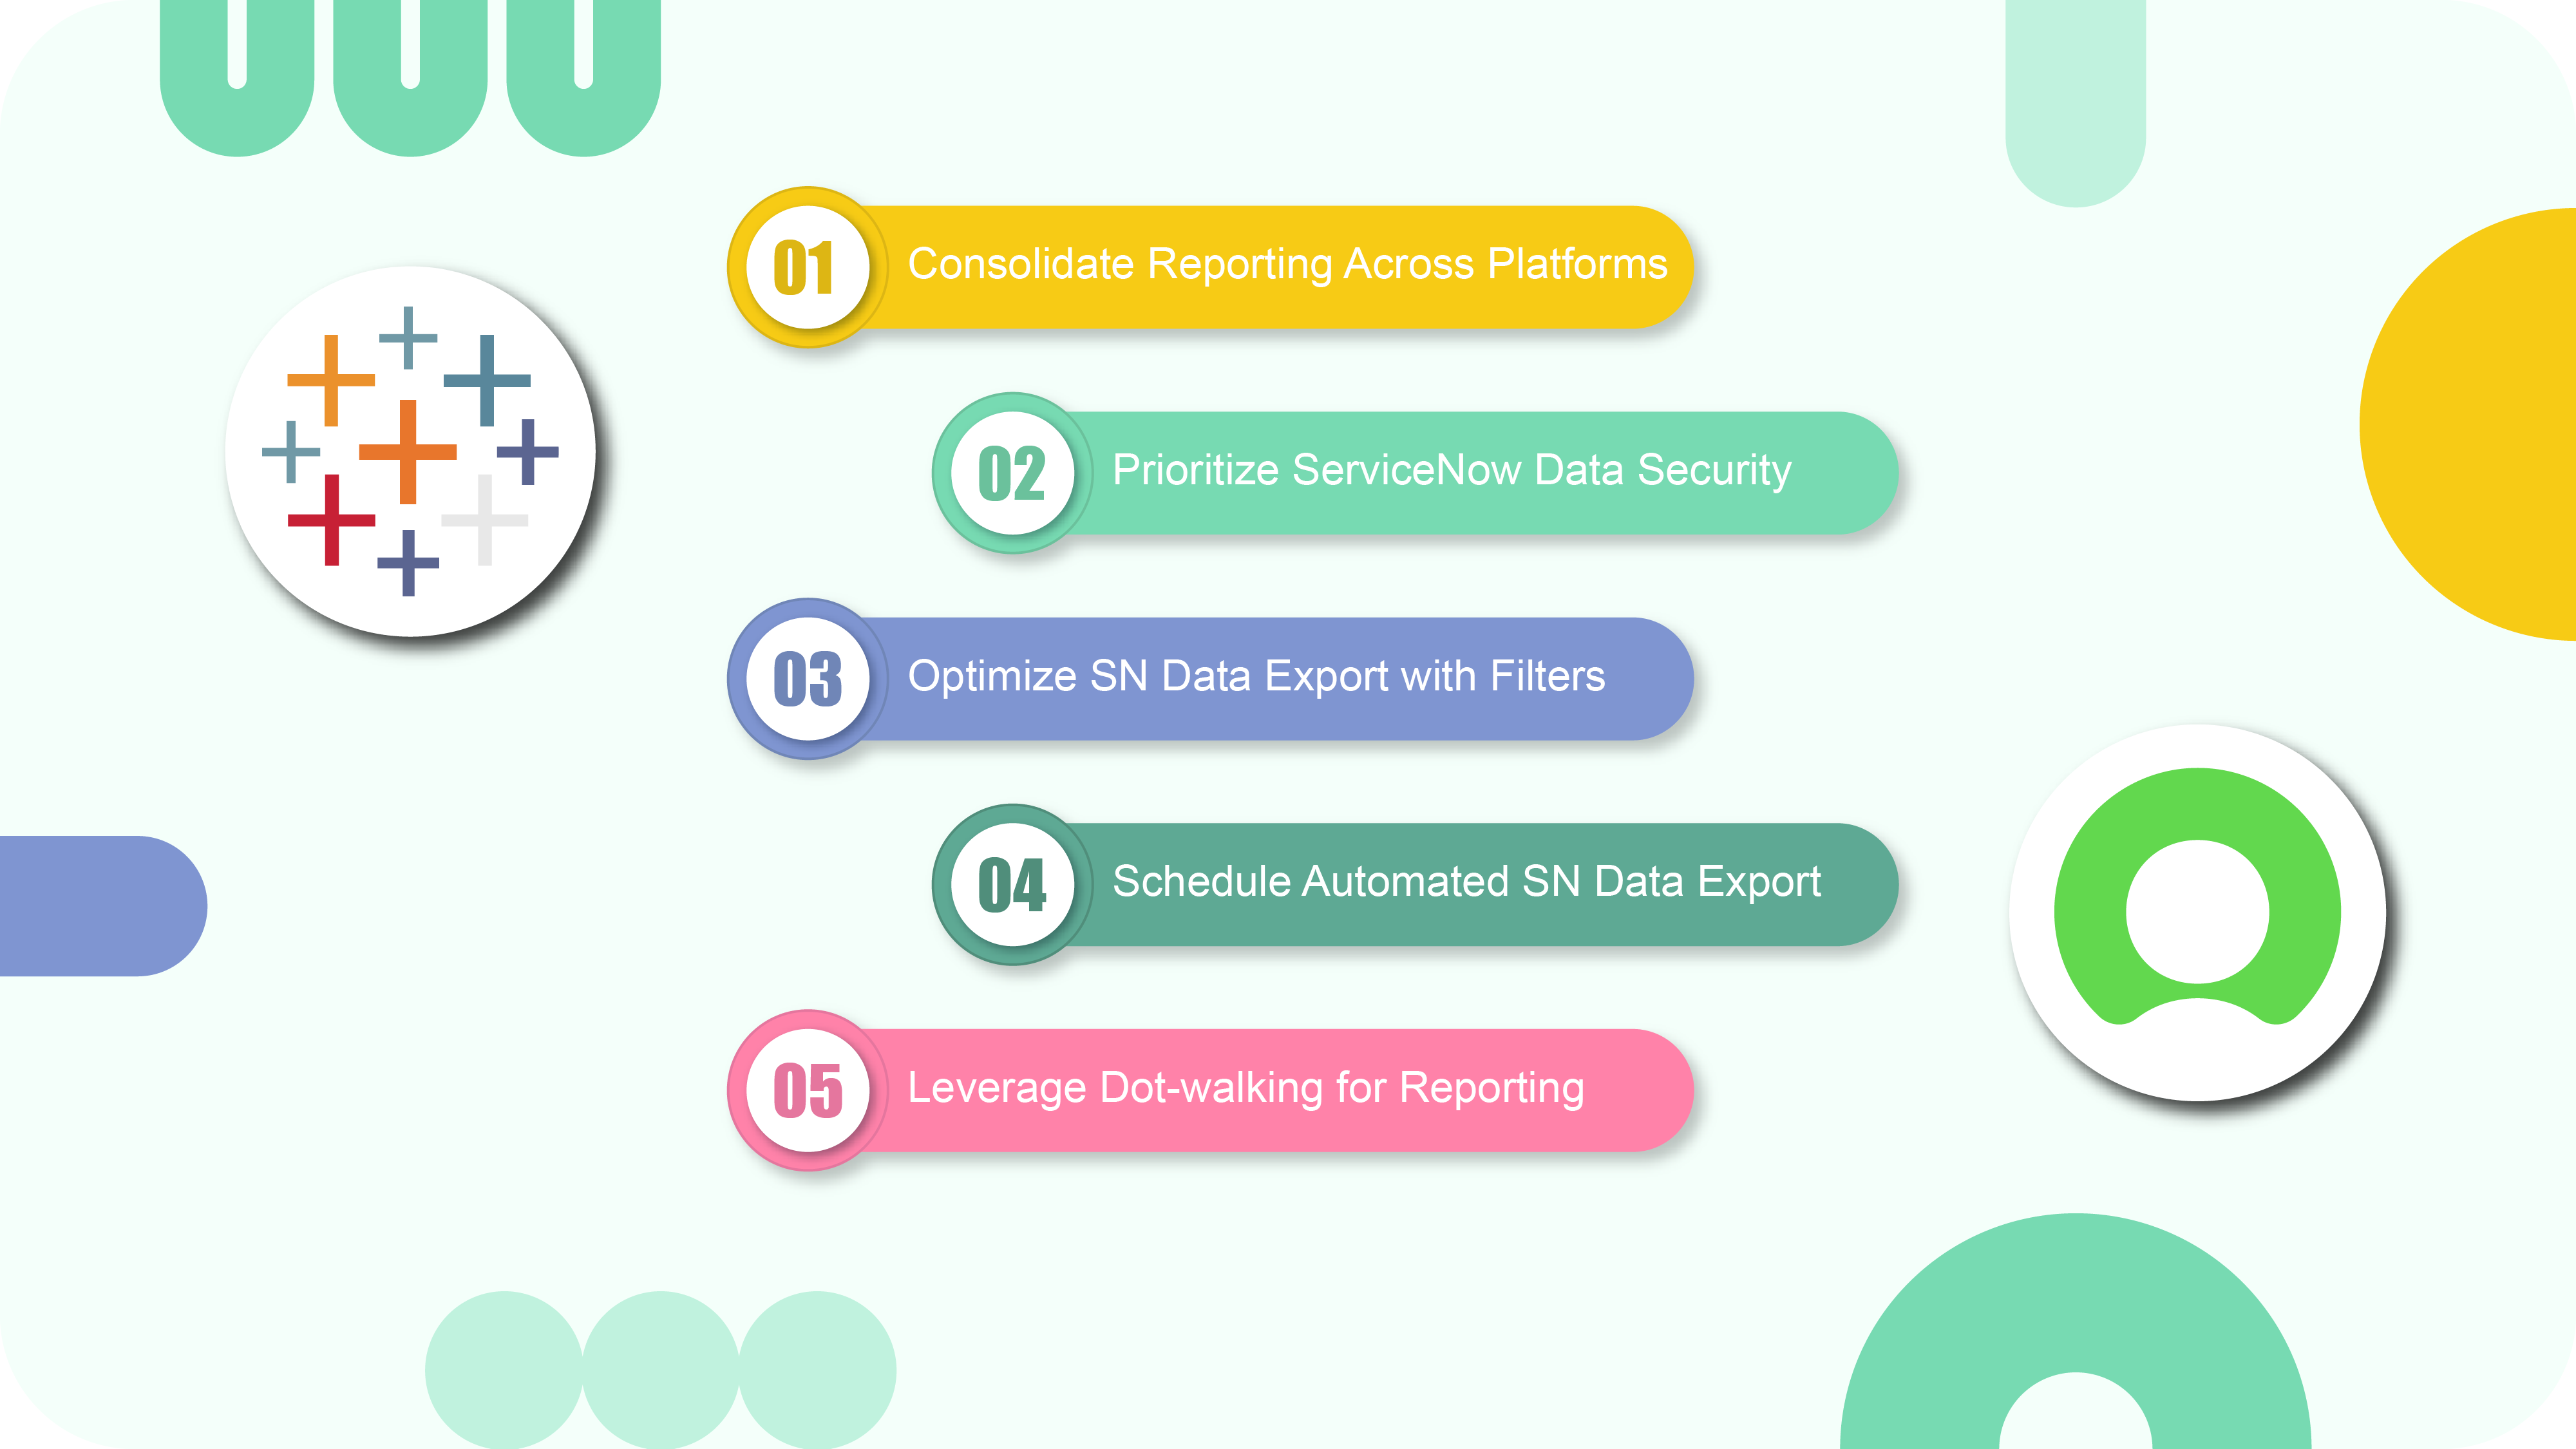
Consolidate Reporting Across Platforms
To create a report in ServiceNow, one needs to collect and magazine different data from various platforms about incident management, ITSM, change management, etc. Tableau can extract this data, giving users the possibility to create interactive reports, dashboards, and visualization. Data integration with other systems like Jira, CRM, or ERP can provide awareness to organizations and enable them to make informed decisions using statistical data analysis.
Prioritize ServiceNow Data Security
The use of the Tableau Connector for ServiceNow grants permissions and ensures data safety. It assigns roles like Admin, Editor, and Viewer to control data access and security and safeguard sensitive information. These roles determine the permissions for tables’ exportation. The admin has the most access and can read, write, create, and delete data sources, while the viewer can export ServiceNow data to Tableau. The Tableau Connector for ServiceNow is developed with your data privacy in mind. It does not collect, store, or share any customer data. Rest assured, all your data remains securely housed within your ServiceNow instance. Follow the link to learn more about the Tableau Connector for ServiceNow user roles.
Optimize ServiceNow Data Export with Filters
The use of filters enables only the exportation of the necessary ServiceNow data to Tableau, reducing export time and enhancing performance. They can be applied strategically by configuring the desired conditions to extract relevant subsets of data, optimizing Tableau performance, and generating reports. To ensure precision and flexibility, the filters must be inspected before exporting.
Schedule Automated ServiceNow Data Export
Tableau streamlines the report generation and distribution process from ServiceNow data, offering automation for scheduled updates. This feature ensures that users consistently receive the latest information, removing the concerns of outdated reports and enhancing data reliability. With Tableau, organizations can manage extensive datasets efficiently and ensure that data is current.
To start, establish a Data Source in ServiceNow using the Tableau Connector by Alpha Serve. Then, export this data to a Tableau Desktop Worksheet for further action.
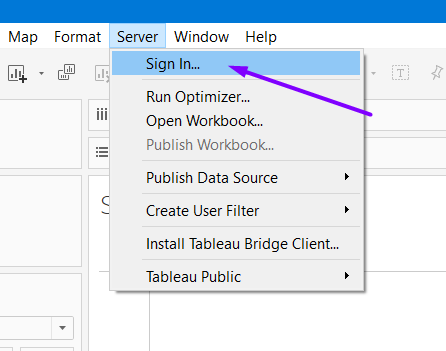
To schedule a refresh access the Tableau server by entering your credentials in the browser. Confirm successful Sign-in.
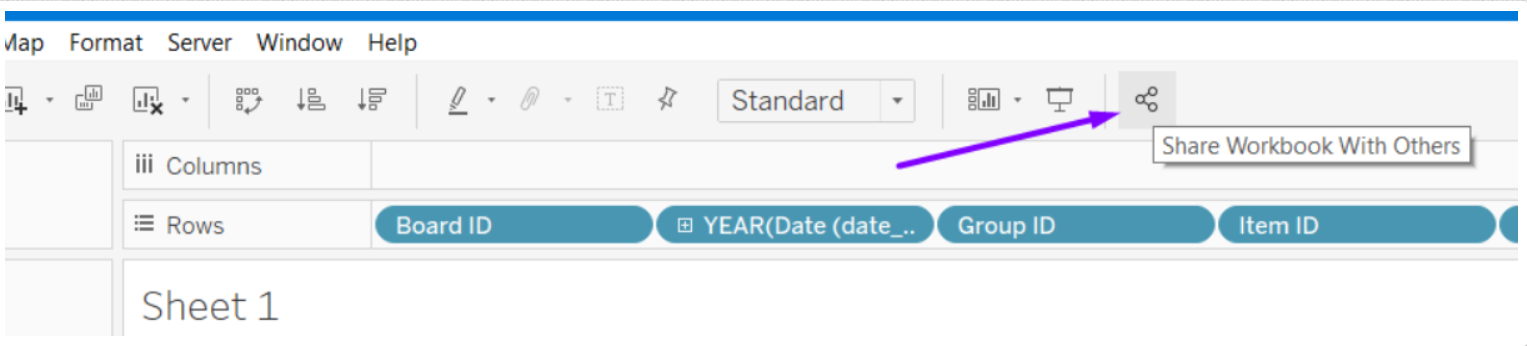
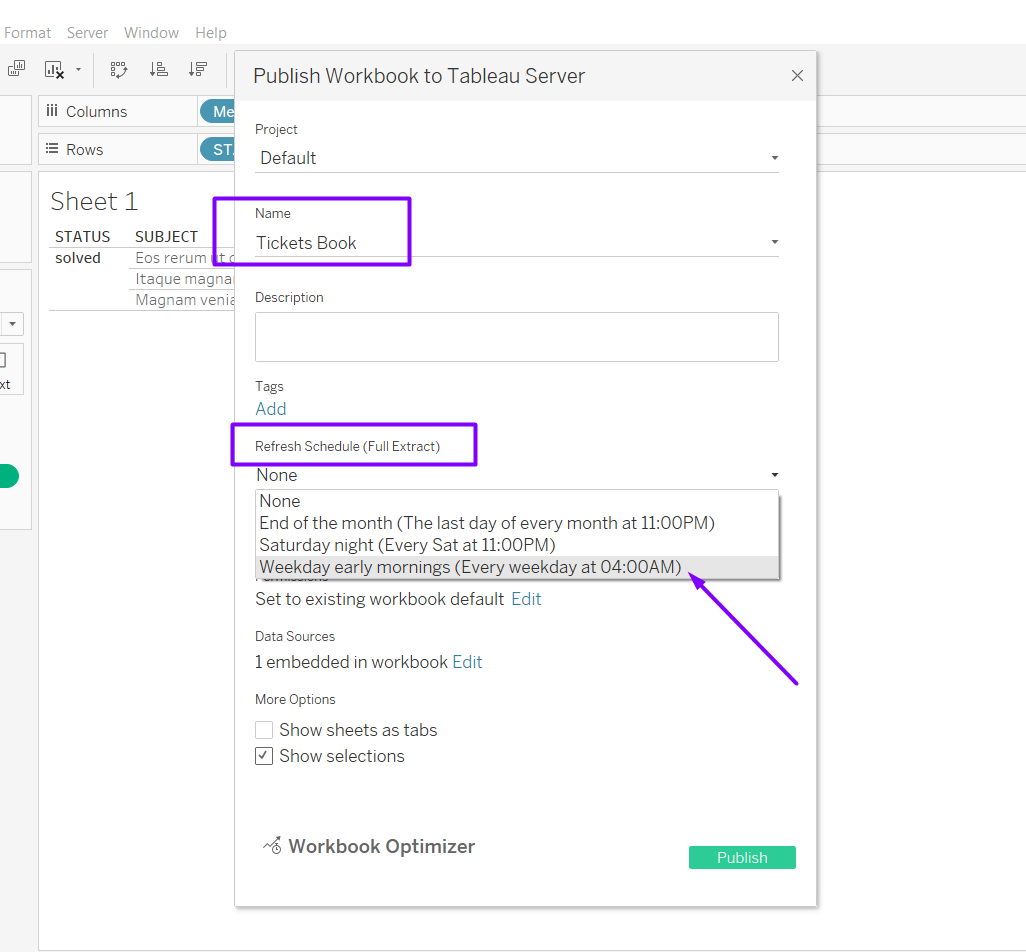
In Tableau, finalize your workbook and select the ‘Share’ option.
Specify essential details like the project, name, and refresh schedule. Proceed to publish your data on the server.
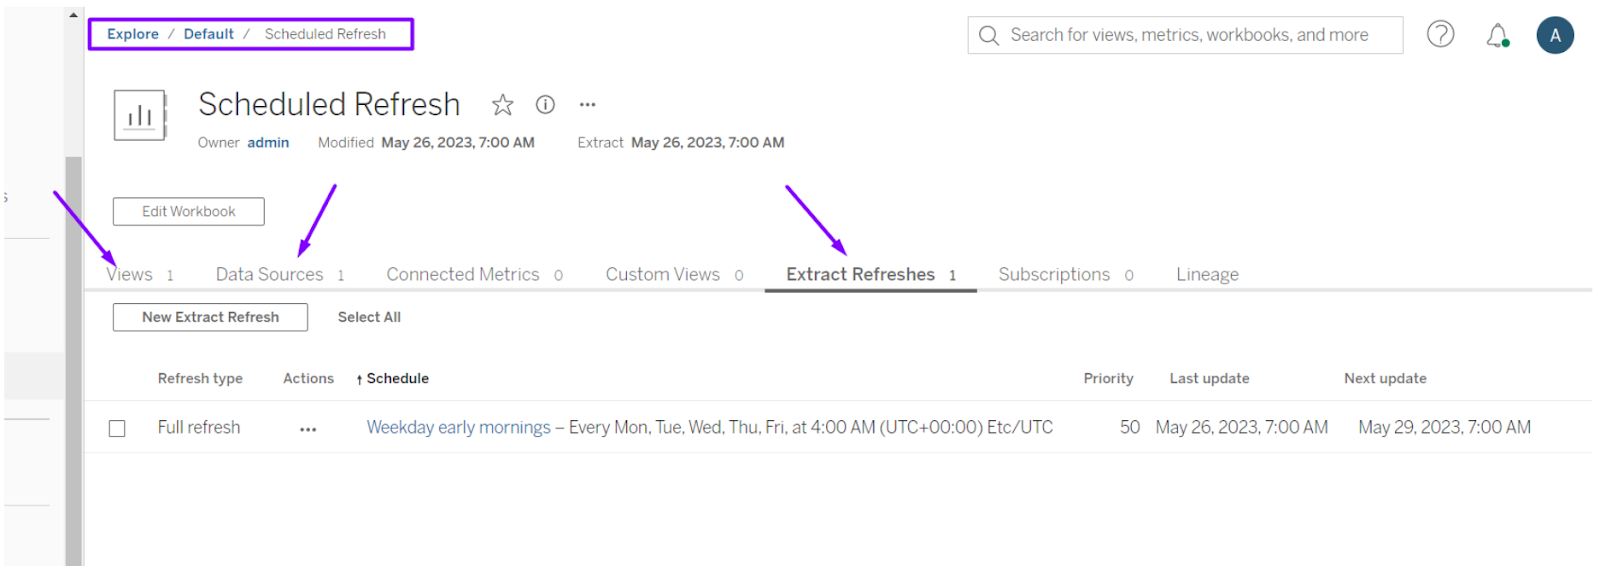
Post-publication, find your project on the server to view the workbook. You can also inspect the Data Source and the scheduled updates under the ‘Extract Refreshes‘ tab here.
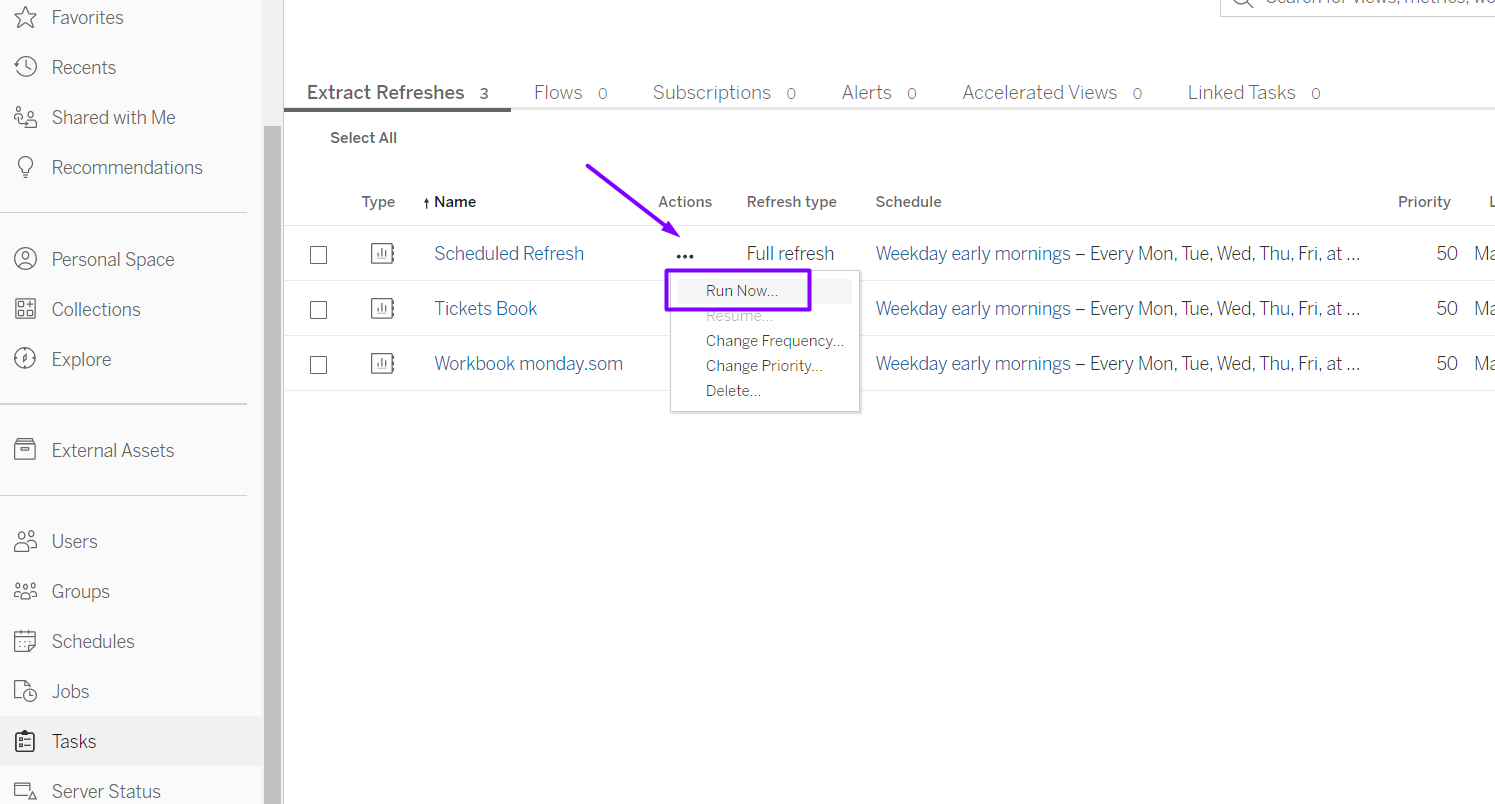
If necessary, initiate manual updates via the ‘Tasks’ tab to maintain data freshness outside the scheduled intervals.
To learn how to publish data on the Tableau server and set up a scheduled task, please refer to our comprehensive guide on our documentation page for detailed instructions.
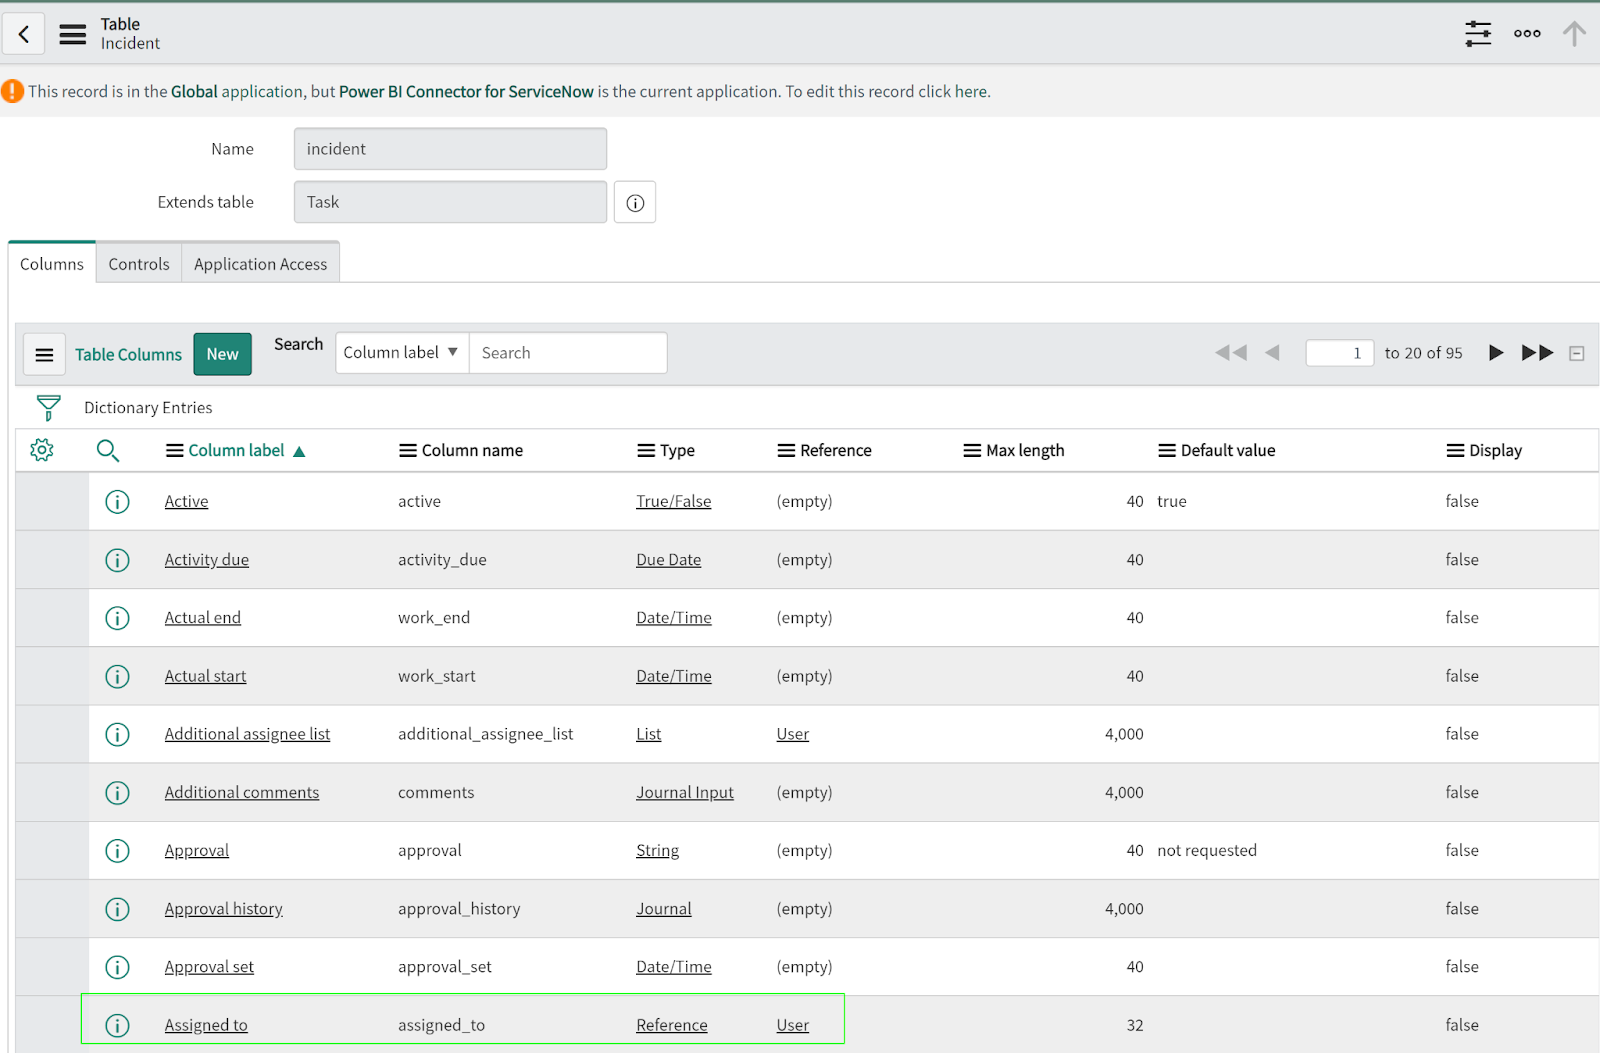
Leverage Dot-walking for Enhanced Reporting
Dot-walking is a powerful feature in ServiceNow that allows for seamless access to interconnected table fields, enhancing the depth and accuracy of your reports. This method simplifies related data integration, offering a more granular view by linking data points across various tables, thereby enriching your data visualizations and insights.
To try dot-walking for exporting Reference type data, go to the Data Source page in ServiceNow (or create a new one). When adding a table that includes Reference type fields, you’ll notice a “+” symbol next to these fields.
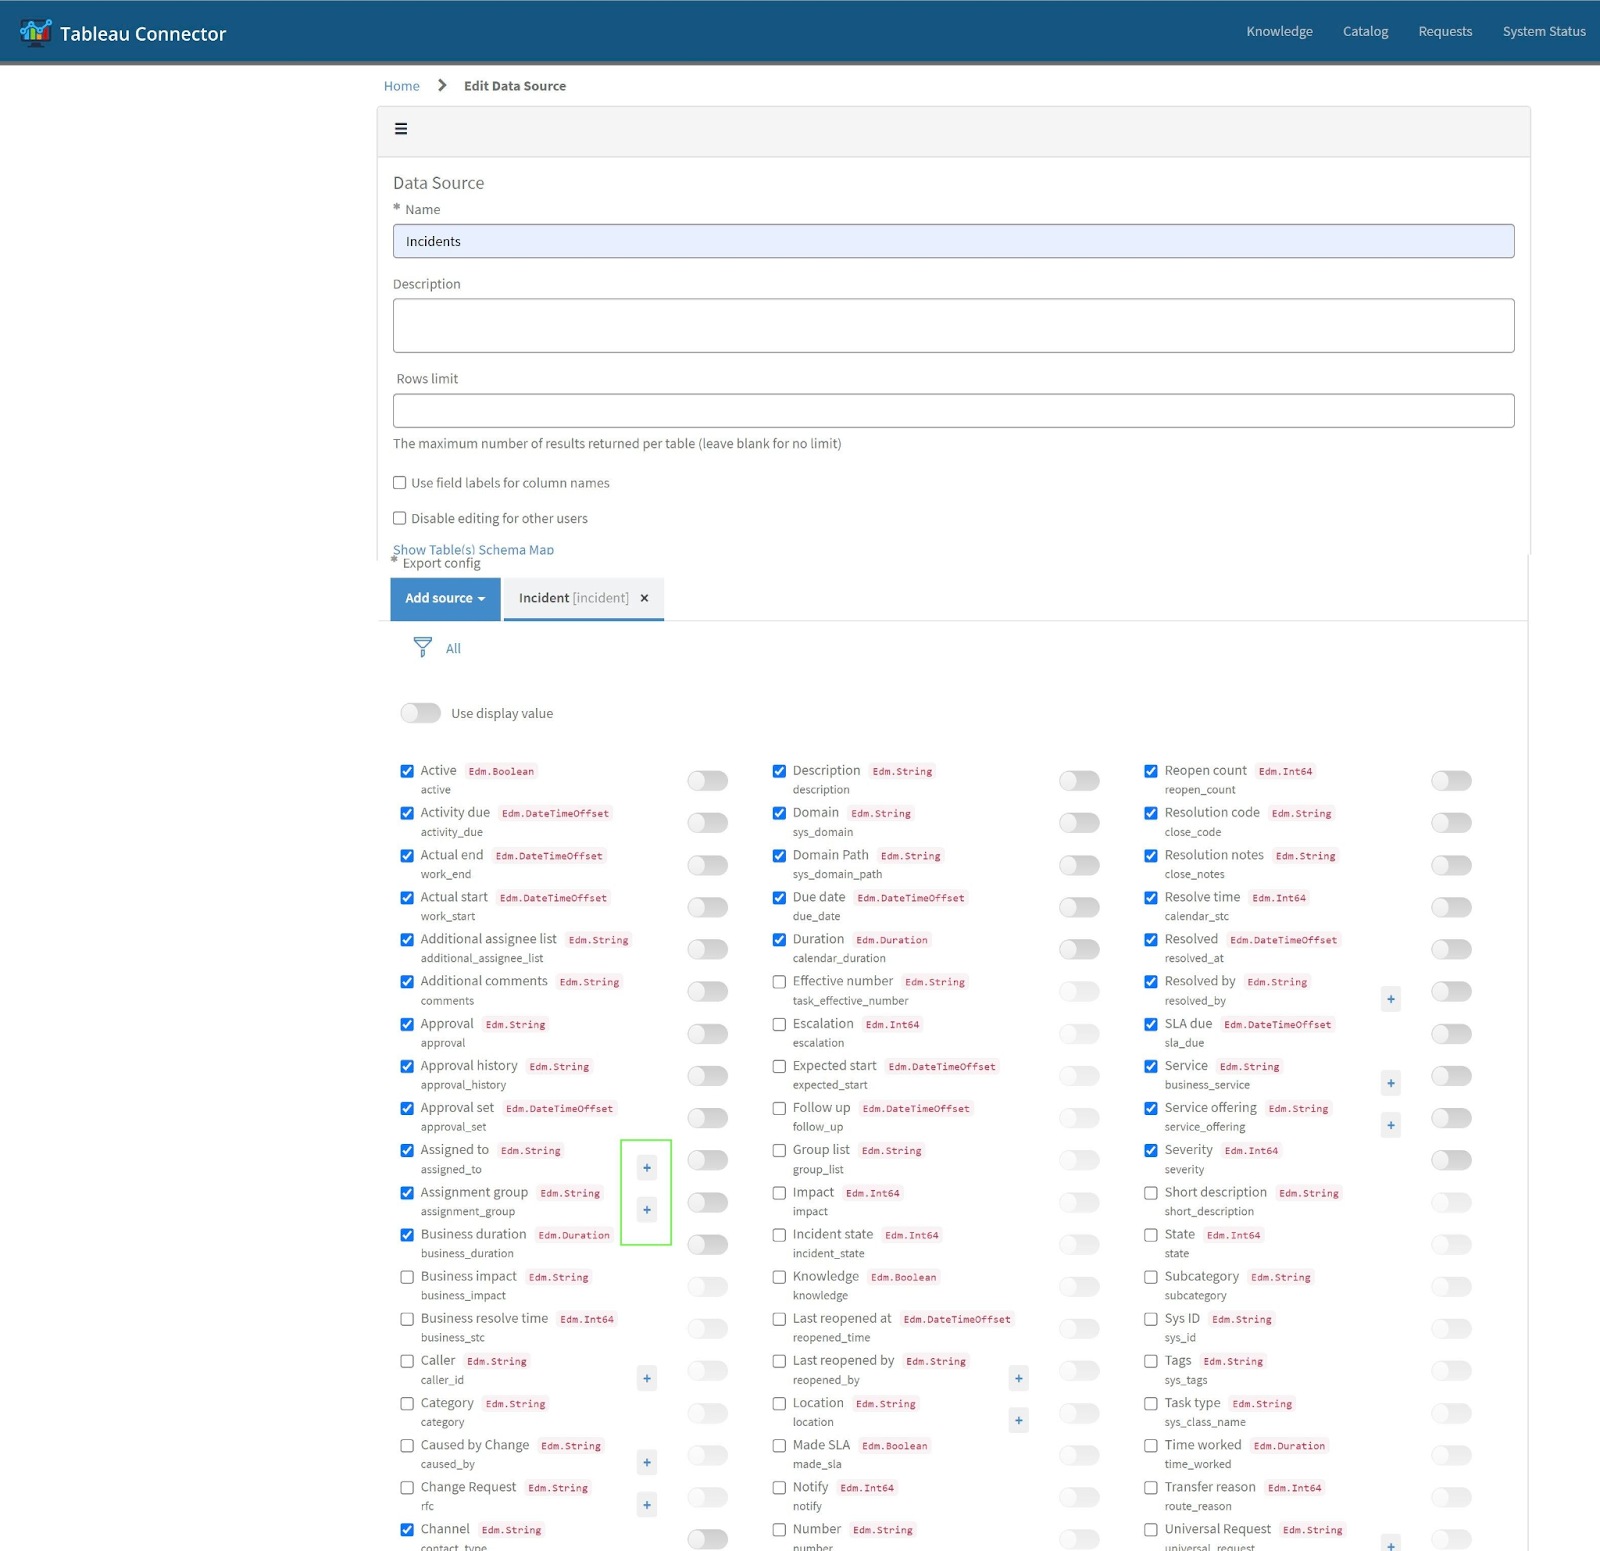
Click on the “+” next to a field to explore its child fields.
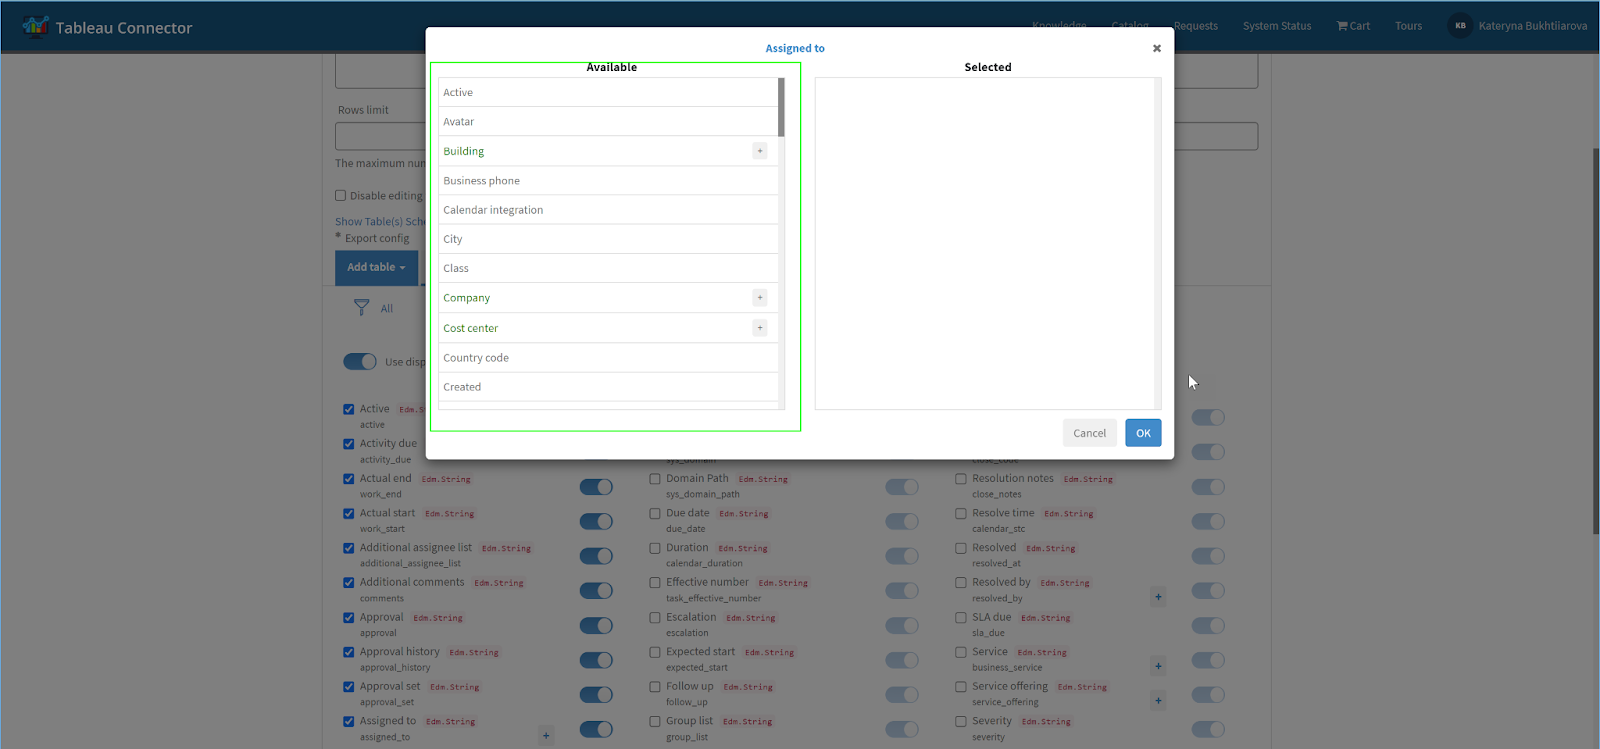
A dialog box will display, showing the parent field at the top and a list of child fields from the referenced table below. If a child field is also a Reference type, it’s highlighted by green color and allows further exploration of its child fields.
Select the fields you need by clicking on them. If you wish to delve deeper into related tables, use the “+” icon near the field to navigate. Once selected, fields appear in the ‘Selected’ column, allowing you to review their paths and modify display settings as necessary.
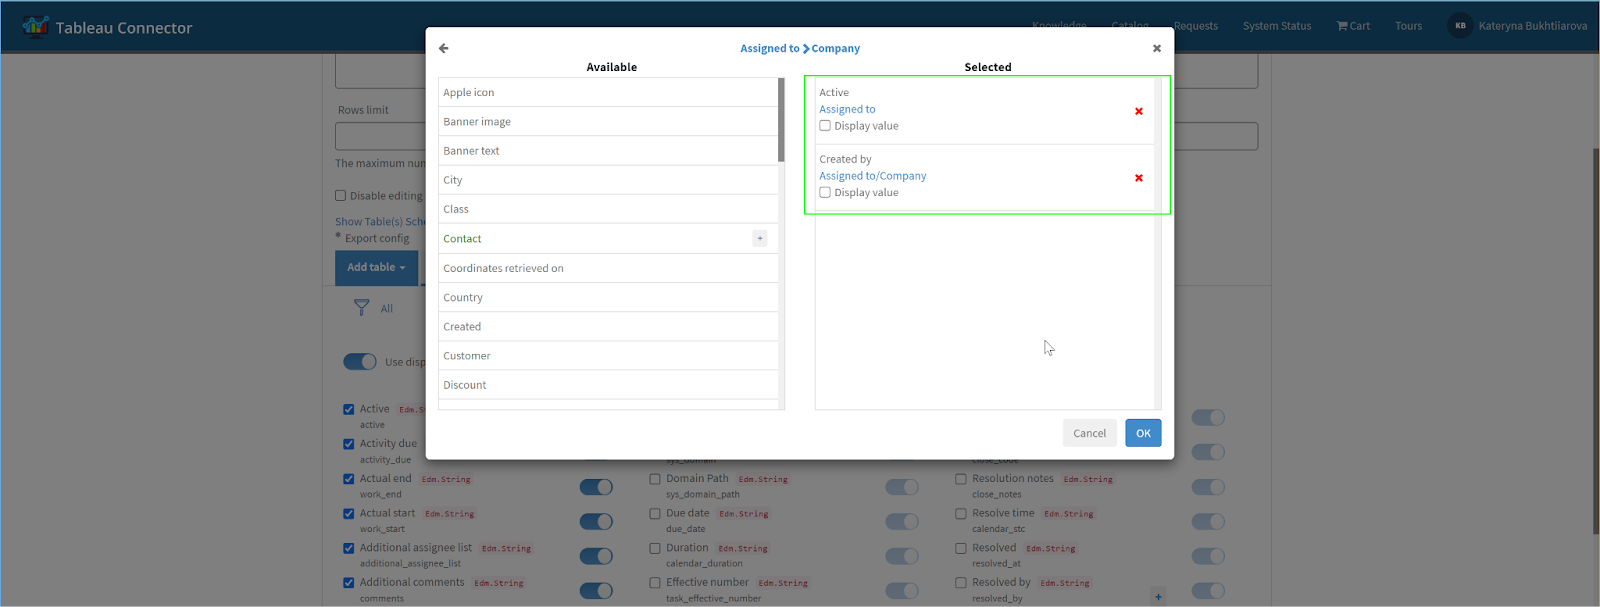
Confirm your selections by clicking “OK” to exit the dialog box.
Save the Data Source, obtain the OData URL, and export it into Tableau Desktop. The newly added child fields will appear as additional columns, enhancing the data’s context and usability in your reports.
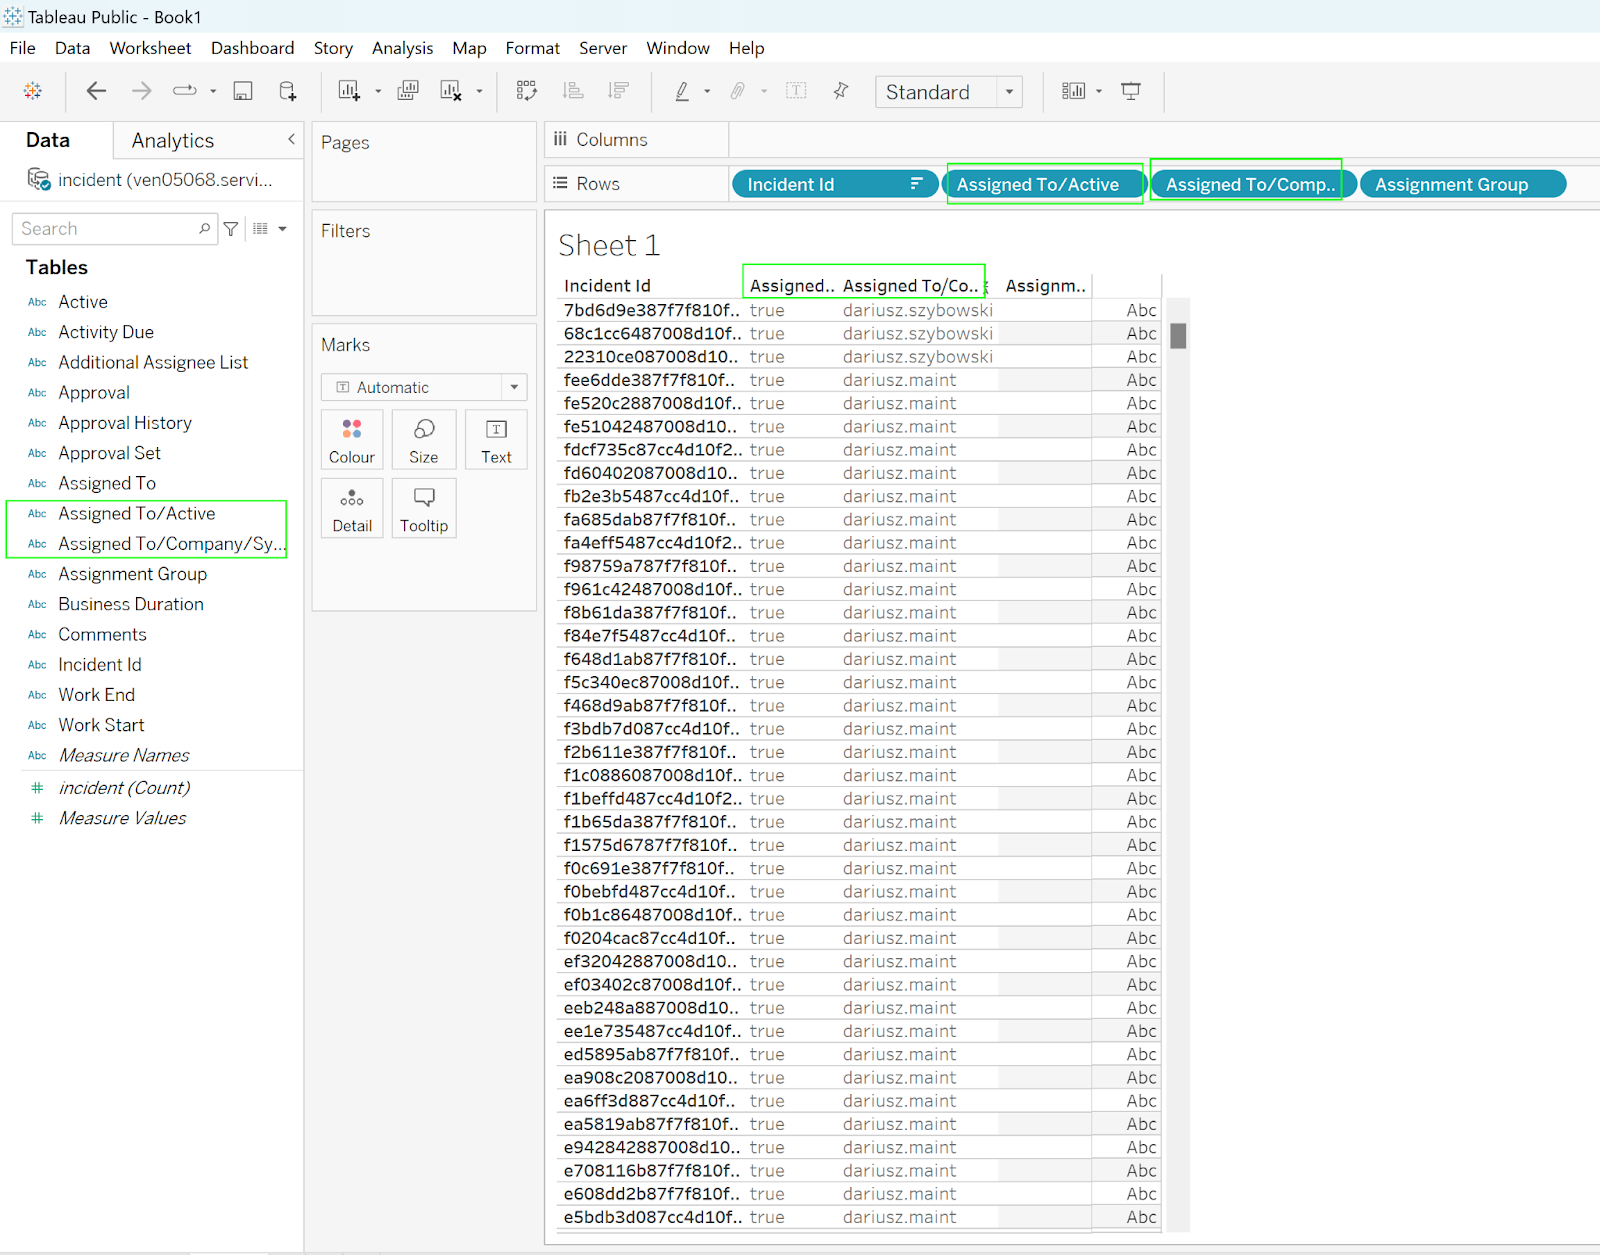
By employing dot-walking, you gain a multidimensional view of your data, facilitating a deeper understanding of the relationships within your ServiceNow environment, which can then be effectively visualized and analyzed in Tableau.
Remember, the available fields and the depth to which you can explore depend on your user permissions within ServiceNow, ensuring secure and compliant data handling. Please visit our documentation page for more detailed instructions on how to use the dot-walking mechanism.
Recap
Both Tableau and ServiceNow are powerful software platforms, and while they are used mainly for different purposes, they can be integrated to enhance ServiceNow’s reporting and data visualization capabilities. Combining the analytical capabilities of Tableau with ServiceNow’s data gives organizations a chance to boost their efficiency and improve data analysis and reporting.
Advanced features such as dot-walking, scheduled data export, and exceptional data visualization enable organizations to benefit from Tableau ServiceNow Advanced Reporting and get deeper insights from their data.
About acSoft Blog
The acSoft blog is your go-to source for expert insights into ServiceNow. As a distinguished ServiceNow Build Partner with certified apps in the ServiceNow Store, acSoft Inc. specializes in the ServiceNow platform, offering in-depth knowledge through articles, tips, and guides. Our content, created by seasoned professionals within the ServiceNow community, provides reliable, up-to-date information to enhance your ServiceNow expertise and experience.