Learn Power BI and Tableau differences in our latest article, which provides a head-to-head comparison of these leading business intelligence tools. Uncover which Tableau Software vs Power BI offers superior data visualization, seamless integration, and user-friendly analytics to empower your business decisions. Whether you’re evaluating Tableau dashboards or Power BI data models, this analysis will guide you in selecting the right BI tool to streamline your data strategy and optimize your organizational insights.
- What is Tableau
- What is Power BI
- Tableau vs Power BI Comparison
- Tableau vs Power BI Pros and Cons
- Which is Better Power BI or Tableau
- Recap
What is Tableau

Tableau represents a sophisticated data visualization and business intelligence instrument designed to enable professionals to maximize data utilization efficiently. The platform is framed to support an analytical and engaging examination of extensive data sets, allowing users to extract pertinent insights and foster informed strategic decisions. Tableau embedded capability to combine various data sources into a single analytical tool underscores its value in offering a cohesive analysis experience.
Tableau is renowned for its advanced functionality in generating interactive visual representations that communicate data narratives succinctly. Users can create detailed dashboards and comprehensive reports, presenting intricate data intelligibly and persuasively. Its scalability caters to various applications, from individual analysts to extensive corporate networks, ensuring vital data insights are readily accessible.
Integrating seamlessly with many business tools, Tableau enhances its strategic utility, rendering it an essential resource for entities striving to establish a robust data-centric culture. In an era where data dynamics continuously evolve, Tableau provides a steadfast resource for uncovering actionable intelligence, thereby empowering organizations to achieve superior analytical measures and business performance.
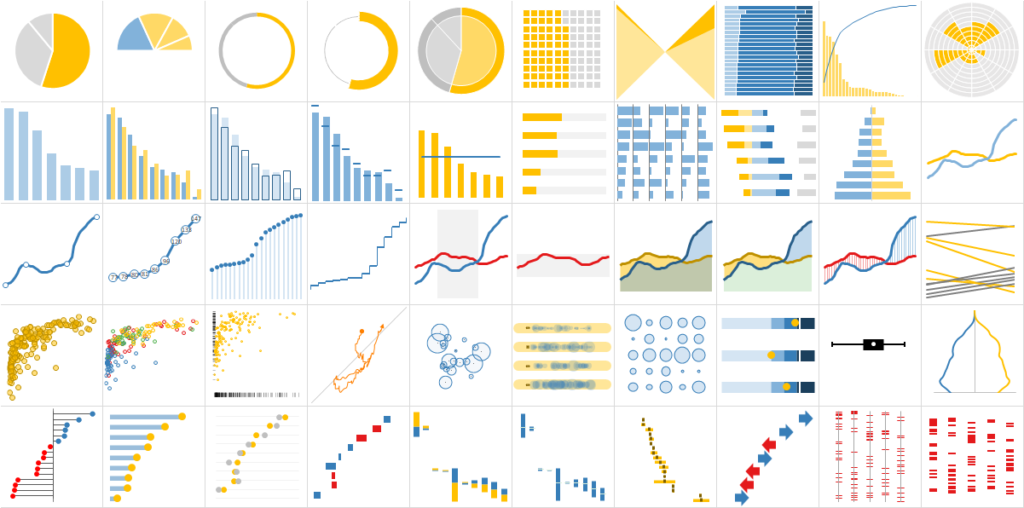
Tableau Charts Example
What is Power BI

Microsoft Power BI is an outstanding tool for modern enterprises aiming to decipher complex data sets and transform them into actionable insights. Offering a suite of business analytics features, Power BI embodies the model of user-friendly interfaces, empowering even non-technical users to build immersive reports and dynamic dashboards.
The multifunctional performance of Power BI lies in its seamless integration with different data sources, enabling users to connect disparate datasets effortlessly and effectively manage data costs and identify new business opportunities. Furthermore, it boasts robust data cleansing and transformation functionalities, ensuring that data quality remains paramount throughout the analytical journey.
Accessible across multiple platforms, including web browsers, mobile devices, and desktop applications, Power BI outperforms the limitations of conventional data analytics tools. Its compatibility with other Microsoft staples, such as Excel and SharePoint, enhances its utility, fostering a synergistic ecosystem for data-driven decision-making.
Power BI features offer sophisticated data modeling capabilities, facilitating complex and predictive data analyses. Through intuitive visualization techniques encompassing charts, graphs, and tables, Power BI consolidates complex datasets into understandable reports, empowering stakeholders to unearth hidden patterns and trends.

Power BI Charts Example
Tableau vs Power BI Comparison

Tableau Power BI comparison is essential to understand their distinct characteristics. Each platform offers unique features and strong points, matching different preferences and requirements in the data visualization domain. Below, we’ll break down the critical difference between Power BI and Tableau, providing a clear comparison across several key aspects:
User Interface
Tableau is renowned for its intuitive and user-friendly interface, which is well-suited for users of all technical levels. Although improving, Power BI is generally considered to have a steeper learning curve, particularly for those unfamiliar with other Microsoft tools.
Performance
Power BI is user-friendly and efficient with smaller data sets but may slow down with larger volumes. Conversely, Tableau excels in rapidly processing and visualizing large data quantities without imposing data point, row, or size constraints, offering comprehensive data analysis experience.
Data Visualization
Tableau is top in the depth of customization and advanced visualization capabilities, offering extensive options for users to tailor their dashboards and reports. Power BI, while capable of visualization, offers more structured and less customizable options.
Data Sources
Tableau offers a wide array of data connection possibilities, including extensive support for third-party sources, making it exceptionally adaptable. In contrast, Power BI demonstrates more rich integration with Microsoft-specific sources, optimizing user experiences within the Microsoft ecosystem.
Products
When comparing Tableau vs Power BI products, each platform presents a unique suite of tools tailored to meet various data visualization and business intelligence needs:
Tableau Products:
- Tableau Desktop: Allows users to analyze data and create interactive reports and dashboards on their local machine.
- Tableau Server: An enterprise solution for sharing, governing, and collaborating on Tableau dashboards and reports.
- Tableau Online: A cloud-based solution that provides the capabilities of Tableau Server without infrastructure management.
- Tableau Public: A free offering that lets users publish interactive data visualizations to the web.
- Tableau Prep: Streamlines data preparation with an easy-to-use visual interface, facilitating quicker analysis.
- Tableau Reader: A free desktop application that lets users view and interact with Tableau reports built by others.
- Tableau Mobile: Provides on-the-go access to Tableau dashboards, enabling decision-making from anywhere.
Power BI Product:
- Power BI Desktop: A free desktop application where users can develop and design reports, perform data analysis, and create visualizations.
- Power BI Pro: A cloud-based subscription service offering advanced collaboration, publishing, and sharing features beyond the Desktop version.
- Power BI Premium: Provides dedicated cloud resources for hosting and sharing Power BI reports and dashboards, suitable for large-scale enterprise use.
- Power BI Service: An online service (SaaS) where users can publish Power BI reports and dashboards, share insights and collaborate with teammates.
- Power BI Mobile: A mobile application available on iOS and Android, allowing access to Power BI reports and dashboards on mobile devices.
- Power BI Report Server: An on-premises server for hosting and managing Power BI reports, integrating with SQL Server Reporting Services for a unified reporting environment.
Customization
Tableau stands out for its superior customization options, allowing users to tweak nearly every aspect of their visualizations. Power BI provides a structured approach to customization, which, while user-friendly, may not cater to users seeking extensive personalization.
Learning Curve
When it comes to compare Power BI and Tableau, the Power BI learning curve is generally more accommodating, especially for those already familiar with Microsoft tools. Tableau, despite its user-friendly interface, can require more time to master, particularly for leveraging its full range of advanced features.
Cost
Power BI pricing offers a more cost-effective solution than Tableau, with its Pro version priced under $10 monthly per user and an annual subscription close to $100. Power BI Premium costs $4,995 per month for dedicated resources. In contrast, Tableau Pro version is over $35 per user monthly, with annual fees of nearly $1000. Tableau Creator is $70/month, and Viewer is $12/month, making Power BI a preferable initial choice for startups or smaller businesses with the option to switch to Tableau for more extensive needs.
Tableau pricing vs Power BI comparison shows that Power BI has more affordable pricing, particularly for startups and small businesses. It makes it a preferable initial choice compared to Tableau, with the option to switch to Tableau for more extensive needs in the future.
Community Support
Tableau’s large and active user community is a rich resource for troubleshooting, learning, and sharing. Power BI’s community is also strong and valuable for those seeking guidance on Microsoft integration and utilization.
Programming Languages
Power BI allows using Data Analysis Expression (DAX) and M language for data tasks, with additional support for integrating R via Microsoft analytics. Tableau offers greater versatility, providing simpler integration with R and the ability to use its SDK with various programming languages, including Python, Java, C, and C++.
Mobile Accessibility
Power BI provides a full-featured mobile application, ensuring users can access and interact with their data on various devices. Tableau’s mobile app also supports data interaction and visualization, though its functionalities might be perceived as more limited compared to Power BI’s mobile offerings.
Security
Power BI leverages Azure BLOB storage and SQL databases for data security, offering row-level security and using Azure Active Directory for authentication and TLS for secure communication. Tableau allows customizable security settings, including predefined user roles like Viewer, Interactor, and Editor, and supports RLS for administrators. It advises using SSL and HTTPS for secure data exchanges between clients and servers.
Tableau vs Power BI Pros and Cons

When weighing the advantages of Tableau over Power BI, it’s crucial to consider the pros and cons of each platform to make an informed choice that aligns with your exact business needs and objectives.
Tableau Pros
These key advantages of Tableau, ranging from intuitive design to extensive connectivity and advanced security, underscore its value in transforming complex data into clear, actionable insights.
- Intuitive Interface: Tableau stands out for its intuitive design, allowing users to navigate and utilize its features without extensive training, streamlining the data visualization process.
- Rich Visualization Options: The platform offers a wide array of visualization choices, enabling the creation of detailed and varied data representations that can be customized to suit specific needs.
- Real-Time Data Interaction: Tableau allows for direct interaction with real-time data, providing instant insights and enabling users to swiftly adapt to new data, thereby supporting prompt and informed decision-making.
- Collaborative Capabilities: Tableau promotes teamwork by allowing multiple users to work on the same data visualizations, enhancing collaborative analysis and shared insights.
- Extensive Connectivity: It connects seamlessly with numerous data sources, from spreadsheets to databases, ensuring users can efficiently aggregate and analyze data from disparate sources.
- Mobile Accessibility: Tableau’s mobile-responsive design ensures that users can access and interact with data visualizations on various devices, providing flexibility and on-the-go insights.
- Embedded Analytics: The Tableau software allows the embedding of analytics into existing business applications, enhancing the value and accessibility of data insights within organizational workflows.
- Advanced Security Features: Tableau provides strong security measures, ensuring that sensitive data is protected and access is controlled, maintaining data integrity and compliance.
- Customizable Dashboards: Users can generate Tableau dashboards to meet their individual analytical requirements, providing personalized views and insights that align with their objectives.
- Tableau Community Support: A strong and active Tableau community offers a wealth of resources, from forums to tutorials, aiding users in maximizing their data analysis experience and overcoming any challenges.
Tableau Cons
While the benefits of Tableau are numerous, it presents key disadvantages that can significantly affect user experience and organizational adoption:
- High Cost: The substantial investment required for Tableau’s licenses and maintenance and training costs places it beyond the budgetary reach of many small to medium-sized enterprises.
- Pricing Model Rigidity: Tableau’s inflexible pricing structure does not accommodate the varying needs of different businesses, potentially leading to over-licensing and underutilizing purchased features.
- After-Sales Service Gaps: There are notable concerns regarding the effectiveness of Tableau’s customer support post-purchase, particularly in addressing and resolving specific software issues.
- Data Security Limitations: While Tableau provides some level of data protection, it lacks a comprehensive, centralized approach to data security, primarily offering only row-level security.
- Reliance on IT Expertise: To fully leverage Tableau, there’s a significant dependency on IT skills, particularly for advanced data manipulation and query development, which could be a barrier for less technical users.
Power BI Pros
Power BI, an expansive tool for business analytics, offers multiple features released to enhance data analysis, visualization, and sharing. Here’s a breakdown of some key Power BI capabilities:
- Dynamic Visualizations: With a wide range of visualization options, including custom visualizations with R and Python, among all the benefits of Power BI, it enables users to glean insights effortlessly from their data.
- Complex Data Exploration: Power BI facilitates in-depth exploration of large datasets, empowering users to extract valuable insights and uncover hidden patterns.
- Efficient Data Management: Through Power Query, users can quickly source and transform data, streamlining the data preparation process for analysis.
- AI-powered Insights: Power BI offers AI-powered features, allowing users to uncover patterns, trends, and anomalies in their data automatically, accelerating decision-making processes.
- Seamless Integration: Power BI offers integration with Microsoft Excel and extends its capabilities to include ServiceNow Power BI integration and more, streamlining data analysis across various platforms.
- Automatic Data Refreshes: With automatic data refreshes in Power BI Pro or Premium versions, users can ensure their reports and dashboards are always up-to-date with the latest data.
- Mobile Accessibility: The Power BI Mobile App allows users to access reports and dashboards on-the-go, ensuring flexibility and convenience in data analysis.
- Collaborative Features: Power BI facilitates collaboration by allowing users to reuse datasets across reports and dashboards. It also seamlessly integrates with Microsoft products.
- Monthly Product Updates: Power BI receives regular updates, ensuring users have access to the latest features and enhancements to drive continuous improvement.
Power BI Cons
The benefits of Power BI are numerous, but it also has limitations that can hinder users’ effectiveness in data analysis and reporting. By understanding these drawbacks, businesses and individuals can make informed decisions about using Power BI in their data strategies.
- Query Editing and Performance: Power BI query editor can be slow and intricate, hindering timely and precise data analysis.
- User Interface and Usability: Power BI interface falls short in intuitiveness compared to rivals, potentially elongating the learning phase and slowing down tasks for newcomers or those from more user-friendly environments.
- Data Management and DAX: The platform’s complex data management and DAX language can daunt non-technical users, making them reliant on IT help for custom calculations.
- Customization Limitations: BI Software comparison demonstrates that Power BI offers limited report customization compared to tools like Tableau, which can frustrate users who need detailed report designs.
- Limited features in the free version: The Power BI free version offers reduced capabilities, including lesser data storage and a more restricted set of features compared to its premium counterpart.
- Handling Large Datasets: Performance issues arise with large datasets, causing delays and inefficiencies in data analysis and reporting.
Which is Better Power BI or Tableau

Deciding between Power BI and Tableau should be based on your organization’s unique requirements, financial scope, and data processing needs. Power BI is an affordable and straightforward solution, particularly for businesses already using Microsoft’s product ecosystem, making it an appealing option for small to midsize enterprises. Conversely, Tableau is an excellent choice for entities that value superior data visualization and analytical tools and are prepared to allocate a higher budget to their BI solutions.
Both platforms offer distinct advantages and can cater to various business intelligence demands, ranging from basic report generation to intricate data analyses. Evaluating the total ownership cost, encompassing both licensing fees and any additional support expenses, is crucial in determining the most suitable tool that aligns with your organization’s distinct needs.
When Choose Tableau
When it comes to managing and visualizing large datasets swiftly and efficiently, Tableau takes the lead. It excels in handling extensive data volumes without slowing down, even with bulk data. Unlike Power BI, Tableau doesn’t impose restrictions on data points, row counts, or size limits in visualizations. This capability ensures users can delve deep into their data, providing a more comprehensive analysis experience.
When Choose Power BI
Power BI offers the unique capability to create real-time streaming datasets directly within the platform, enhancing its data interaction capabilities. It stands out in managing complex relationships between different tables and data sources, resulting in faster analytics and immediate insights. User-friendly and cost-effective, Power BI is an accessible option, especially compared to Tableau. Additionally, it supports advanced data transformations, including integrating machine learning algorithms for clustering during data import, enriching the analytical process.
Recap
Is Power BI better than Tableau? Microsoft Power BI vs Tableau comparison proves that Tableau surpasses Power BI in data exploration and complex dataset visualization, providing more advanced customization and visualization options. It also offers better data connectivity and a more intuitive interface, improving the overall user experience and analytical depth.
Tableau comparison with Power BI reveals unique data handling and visualization strengths, depending on specific needs. Tableau excels in performance with large datasets and unrestricted data visualization, while Power BI is known for real-time data processing, user-friendliness, cost efficiency, and advanced data transformation features. Choose based on your organization’s priorities, whether extensive data sets or cost-effective, real-time data analysis solutions.
About acSoft Blog
The acSoft blog is your top destination for all things ServiceNow. As a reputable ServiceNow Build Partner with Now Certified apps on the ServiceNow Store, we offer expert insights and how-to guides curated by industry professionals deeply immersed in the ServiceNow community. Count on us for clear, reliable, and up-to-date content to enhance your ServiceNow experience.