ServiceNow distinguishes out among cloud services as a complete option for businesses looking for effective service management. Even though ServiceNow comes with built-in reporting features, companies that use ServiceNow may need help with complex reporting demands or prefer a different business intelligence (BI) solution that complies with their corporate standards. To maintain the accuracy of the data analysis process given the volume and complexity of data, workflow management still must be streamlined. To equip businesses with robust visualization capabilities and offer a disciplined framework for coordinating each phase of the technologically sophisticated analysis process, this is where ServiceNow workflow management for Tableau data analysis comes into action.
In this article, we will explore the concept of Tableau ServiceNow Integration and delve into its benefits. We will also go through various methods for integrating Tableau and ServiceNow, the benefits of employing a standalone Tableau Connector for ServiceNow, and the procedures needed to build a seamless connection between these potent platforms for further creating reports in Tableau.
- What is ServiceNow Tableau Integration
- Benefits of ServiceNow Tableau Integration
- Why Use Tableau Connector for ServiceNow
- How to Create ServiceNow Tableau Connectivity
- Recap

What is ServiceNow Tableau Integration
As a ServiceNow user, you may already be familiar with the platform’s powerful capabilities for managing your IT service operations. However, while some organizations find ServiceNow’s built-in analytics capabilities sufficient, many require more advanced analysis, reporting, and data visualization than ServiceNow offers. As ServiceNow’s out-of-the-box analytics are only available for ServiceNow data, organizations are unable to combine it with data from other sources to get a deeper understanding of the organization. Companies that use ServiceNow with complex analytics and reporting needs require a solution that goes beyond ServiceNow’s inherent limitations.
The solution is Tableau ServiceNow integration that seamlessly combines the strengths of Tableau, a renowned business intelligence and data visualization tool, with the rich and extensive data stored within the ServiceNow IT service management platform. This integration empowers ServiceNow users to effortlessly connect their ServiceNow instance with Tableau, enabling them to harness the full potential of their data for advanced analytics and insightful visualizations. By bridging the gap between ServiceNow and Tableau, organizations can unlock new levels of data-driven decision-making and gain deeper insights into their operations, performance, and service delivery.
ServiceNow users can extract data from various ServiceNow modules, such as Incident Management, Change Management, Problem Management, and more. They may develop interactive dashboards, reports, and visualizations to examine the latest changes and KPIs that vary across these ServiceNow modules. ServiceNow users can gain visibility into metrics such as time-to-resolution, service level agreement compliance, change success rate, customer satisfaction, and employee performance and identify areas for optimization within various business functions. It allows for ITSM analysis, customer service management insights, HR analytics, project management optimization, and data blending from various sources.
Benefits of ServiceNow Tableau Integration

ServiceNow reporting has restrictions that may affect enterprises looking for higher-fidelity reporting capabilities, despite offering a way to evaluate and present data. At the same time, the ServiceNow Tableau connection provides users with a host of valuable benefits allowing them to maximize the value of their ServiceNow data, drive operational excellence within their organizations and gain helpful knowledge for better business strategies and performance to be made.
1. Flexible Tableau Data Visualization
Basic visualization options are available in ServiceNow reporting, but advanced features, such as dynamic dashboards and detailed visualizations, are needed. That can hinder effectively communicating insights and engaging stakeholders with eye-catching reports. With Tableau’s robust visualization capabilities, ServiceNow users can transform their raw data into interactive, visually appealing dashboards and reports. Thus by visualizing the change success rate in user-friendly Tableau, users can identify tendencies, assess the impact of changes on system stability, and take proactive measures to improve ServiceNow change management processes.
2. ServiceNow Custom Reporting
ServiceNow reporting often has predefined report templates and limited customization options that restrict the flexibility in creating reports according to specific analytical requirements. The ServiceNow Tableau integration enables users to generate comprehensive and customizable reports that cover various aspects of their business operations. From incident management and problem resolution to change management and service performance, users can create tailored reports with the most relevant metrics and previously hidden correlations. As well as a detailed report about ServiceNow service catalog utilization and adoption, users can identify popular services, monitor usage patterns, and make informed decisions regarding service offerings and catalog enhancements.
3. Advanced Tableau Data Analysis
ServiceNow reporting focuses on presenting data as it is stored in the ServiceNow database. By leveraging innovative Tableau data analysis functionalities, ServiceNow users can conduct in-depth analysis and modeling of their ServiceNow data. They can apply statistical techniques, perform trend analysis, create forecasting models, and implement predictive analytics to uncover hidden insights and anticipate future trends. For example, by in-depth analysis of Customer Satisfaction Score (CSAT) scores in Tableau, experts can identify areas of improvement, track customer sentiment over time, and drive initiatives to enhance user experience.
4. ServiceNow Tableau Centralized Reporting
ServiceNow’s reporting functionality is primarily module-specific, making it challenging to generate reports that span multiple modules and provide a complex data overview. On the other hand, Tableau excels in centralized reporting by providing a unified platform to connect and visualize data from various sources in a single reporting environment. That enables users to access a comprehensive dataset and perform an in-depth analysis of KPIs across multiple dimensions, such as incident management, change management, asset management, and more.
Why Use Tableau Connector for ServiceNow

There are potential challenges to consider when utilizing traditional methods such as API and web-services-based integrations to connect Tableau directly to a ServiceNow instance. These challenges stem from the cloud-based nature of ServiceNow and the strain on bandwidth, leading to possible performance impact on the platform. Executing complex queries, generating reports, and conducting advanced analytics directly on the production instances can further exacerbate these challenges, potentially making data inaccessible.
The Tableau Connector for ServiceNow is a highly configurable application that enables smooth connectivity between Tableau and ServiceNow, empowering users to export ServiceNow tables and fields directly into Tableau for enhanced data analytics and visualization. With the ServiceNow Tableau connector, you can effortlessly create multiple datasets from a wide range of ServiceNow tables, all within a single data source. The user-oriented interface of the connector simplifies the connection process eliminating the need for ServiceNow consultants or developers, allowing for rapid deployment and immediate access to the ServiceNow data transfer process.
The Tableau Connector for ServiceNow offers a host of enterprise-grade features, making it the best choice for ServiceNow integration with Tableau. Here are five notable functionalities that set it apart:
Full Tableau ServiceNow Integration
The connector facilitates data exploration by providing access to a wide range of ServiceNow tables and fields in Tableau, including custom ones. It supports seamless integration with Tableau, allowing you to combine ServiceNow data with other data sources for a comprehensive view of your organization’s operations. Companies that use ServiceNow can easily navigate and explore their ServiceNow data, applying filters, sorting, and drilling down into specific details. This comprehensive data access empowers to perform in-depth analysis and answer critical questions without limitations in a short time frame.
Powerful Dot-Walking Mechanism
The Tableau Connector for ServiceNow not only offers seamless integration and comprehensive data export but also provides powerful dot-walking capabilities. With a dot-walking mechanism, you can effortlessly navigate and include fields from related tables within your ServiceNow instance. It allows you to explore complex relationships and dependencies in your ServiceNow data, obtaining a holistic view of your ServiceNow data landscape and understanding the interconnectedness of various entities. For example, you can easily access and analyze data from linked tables, such as incident details, associated tasks, related assets, or user information. This capability empowers you to uncover facts that may not appear at first glance.
Hassle-Free Scheduled Refresh
In addition to its dot-walking capabilities, the Tableau Connector for ServiceNow offers the convenience of a scheduled refresh feature. With the scheduled refresh, you can automate the data update process, ensuring that your Tableau visualizations always reflect the most current information from your ServiceNow instance without requiring manual intervention. For example, suppose you’re tracking key performance indicators (KPIs) in your ServiceNow instance. In that case, you can set up a scheduled refresh to retrieve and update the KPI data in Tableau at regular intervals. It ensures that your visualizations always reflect the most current KPI values, enabling you to monitor performance trends and make informed decisions on time. That saves time, improves data accuracy, and enhances your Tableau visualization’s usability.
Robust Permission Settings
Data security is of utmost importance, and the connector prioritizes it. It operates within the secure confines of your ServiceNow instance, ensuring that your data remains protected. Additionally, it provides robust permission settings and access management features to ensure secure data sharing within your organization. By implementing fine-grained permission settings, you can restrict access to sensitive information, ensuring only authorized individuals can view and analyze the data. Additionally, you can define data access rules based on user roles, departments, or other criteria, granting different levels of data access to different stakeholders. That level of control enhances data governance and minimizes the risk of unauthorized data exposure.
How to Create ServiceNow Tableau Connectivity
Establishing the connection between ServiceNow and Tableau is a straightforward and user-friendly process. This guide will walk you through the clear instructions, ensuring you can connect directly to ServiceNow and Tableau without hassle. Follow the steps below whether you want to build interactive dashboards, generate comprehensive reports, or gain a more profound understanding of your ServiceNow data.
Visit the ServiceNow Store and use the search functionality to find the Tableau Connector for ServiceNow.
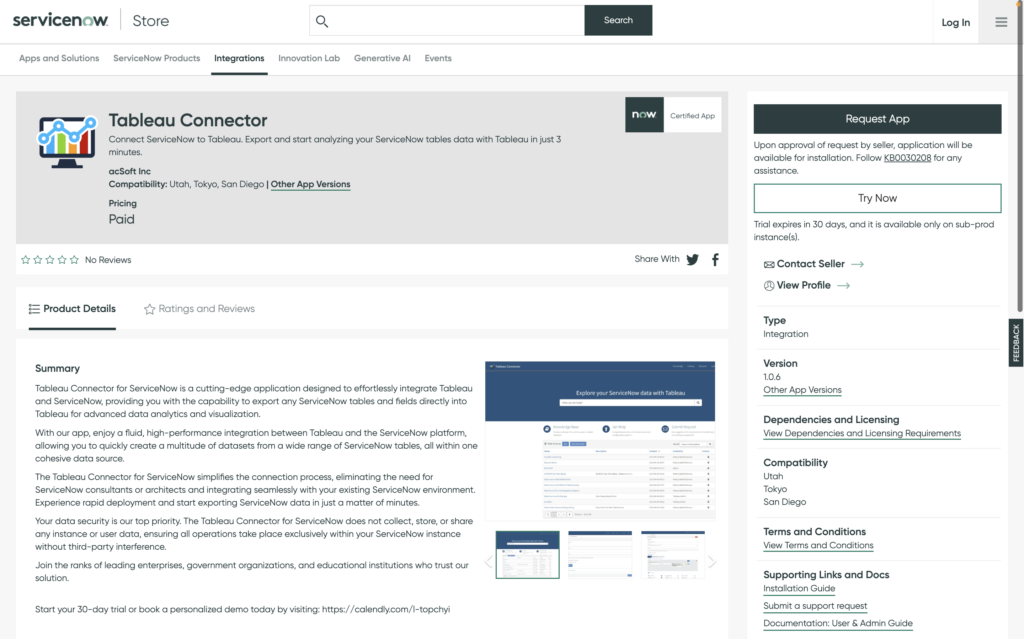
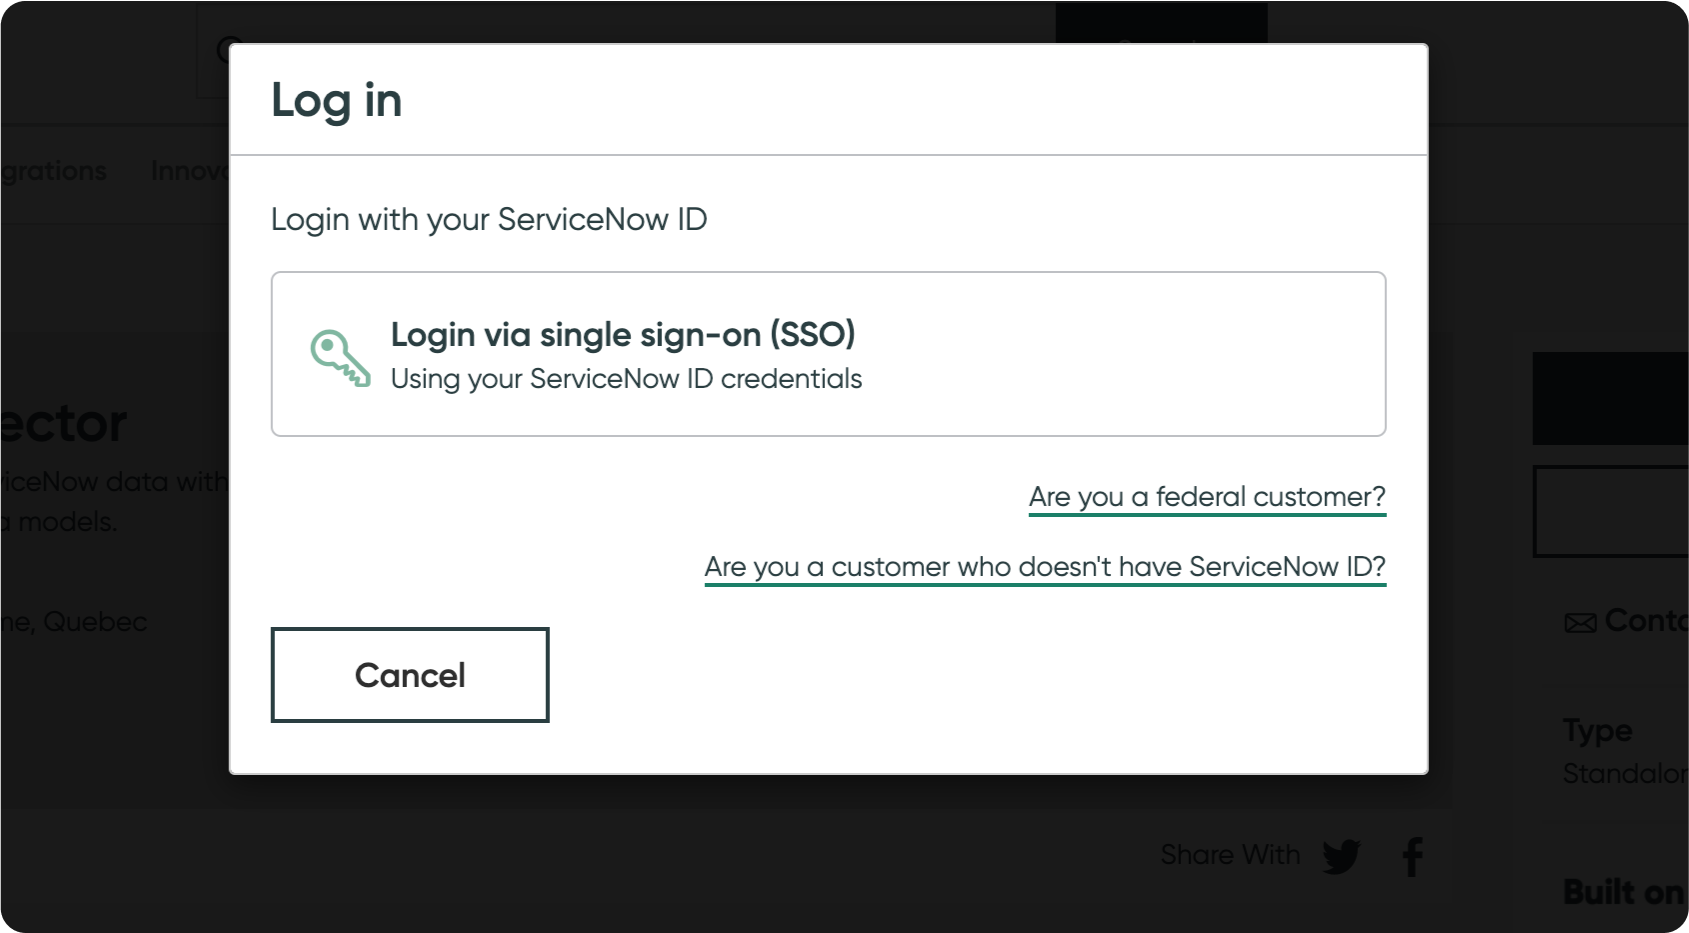
Click the “Try” button and log in with your HI credentials. If you don’t have HI credentials, request your ServiceNow admin to install the trial version. Accept the Terms of Use and proceed with the installation.
You can find the Tableau Connector in the System Applications section of your sub-production instances by navigating to All Available Applications and then to All.
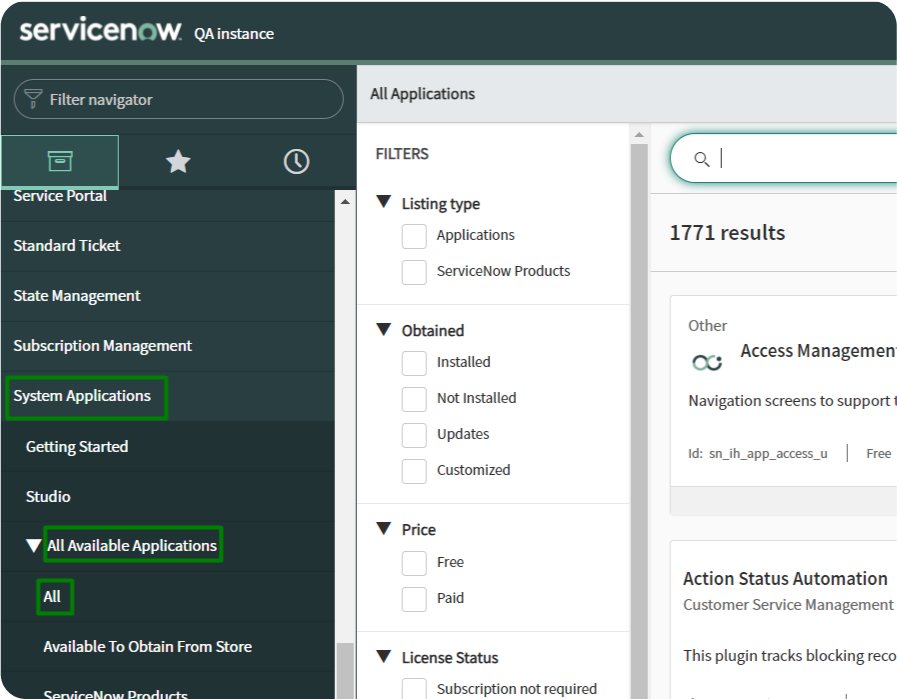
Click Install the Tableau Connector for ServiceNow, and it will be ready to use. The trial version offers the same full functionality as the paid version so that you can explore its capabilities and features. If you want to buy the connector, please click here for more information.
1. Create a Data Source in ServiceNow
Confirming that the ServiceNow System Admin has given users specific roles before using Tableau Connector for ServiceNow is essential. Please contact your system administrator and ask to be assigned one of the following user roles if you cannot access the connector.
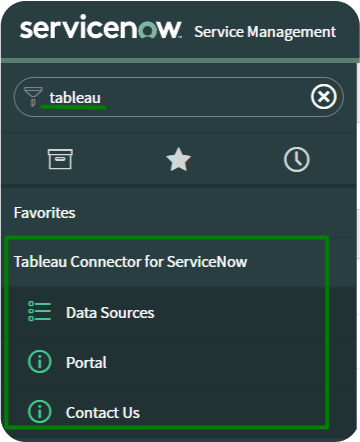
Once the roles have been assigned, users can access Tableau Connector through various interfaces:
- Visit the platform UI to access the Tableau Connector: Instance-Name.service-now.com/.
- Access the Tableau Connector through the main page at Service Portal: Instance-Name.service-now.com/sp.
- Directly navigate to the Tableau Connector page: Instance-Name.service-now.com/tableau_connector.
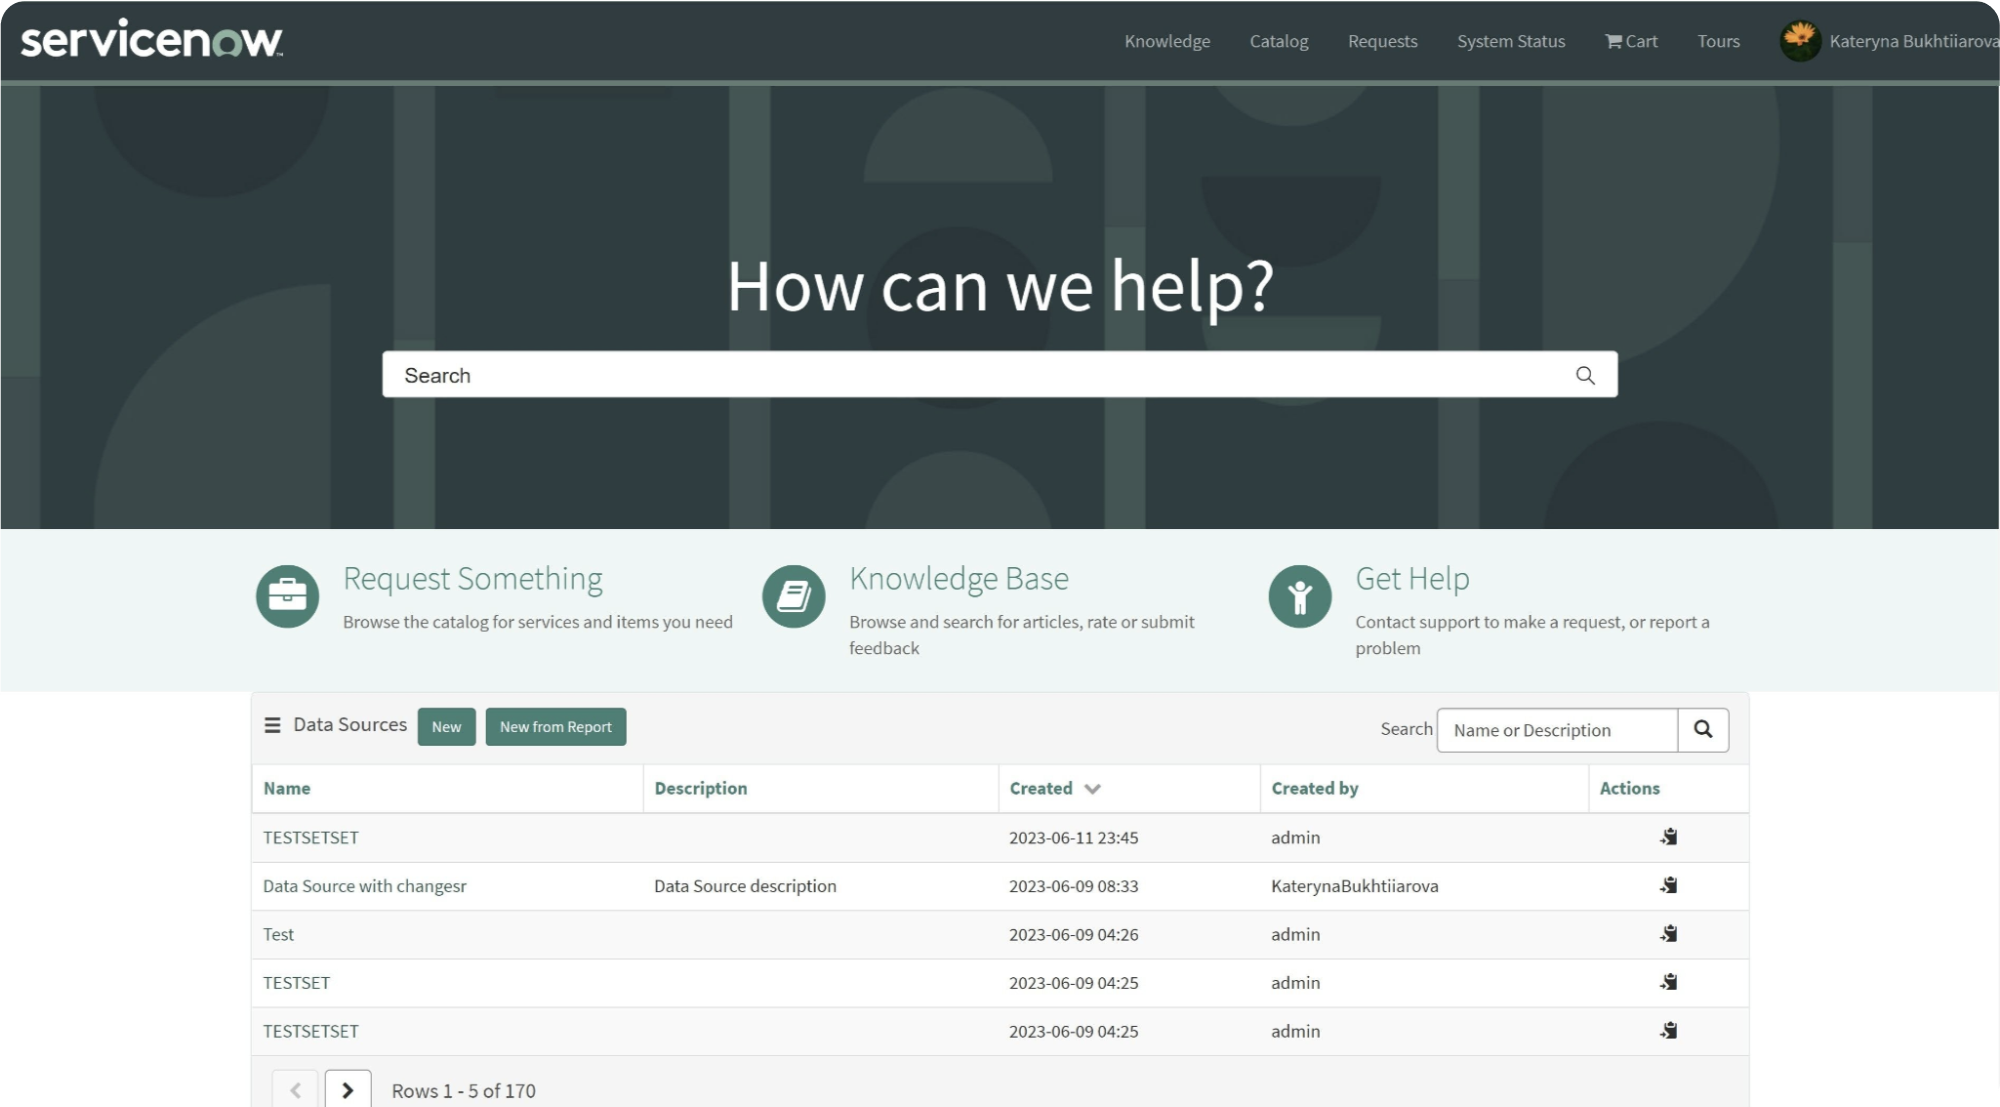
To create a Data Source using Tableau Connector for ServiceNow, users must have either the TABLEAU ADMIN or TABLEAU EDITOR role assigned. Once you have the appropriate role, from the Service Portal at Instance-Name.service-now.com/sp, scroll down to locate the Data Sources table. Click the “New” button to initiate the Data Source creation process.
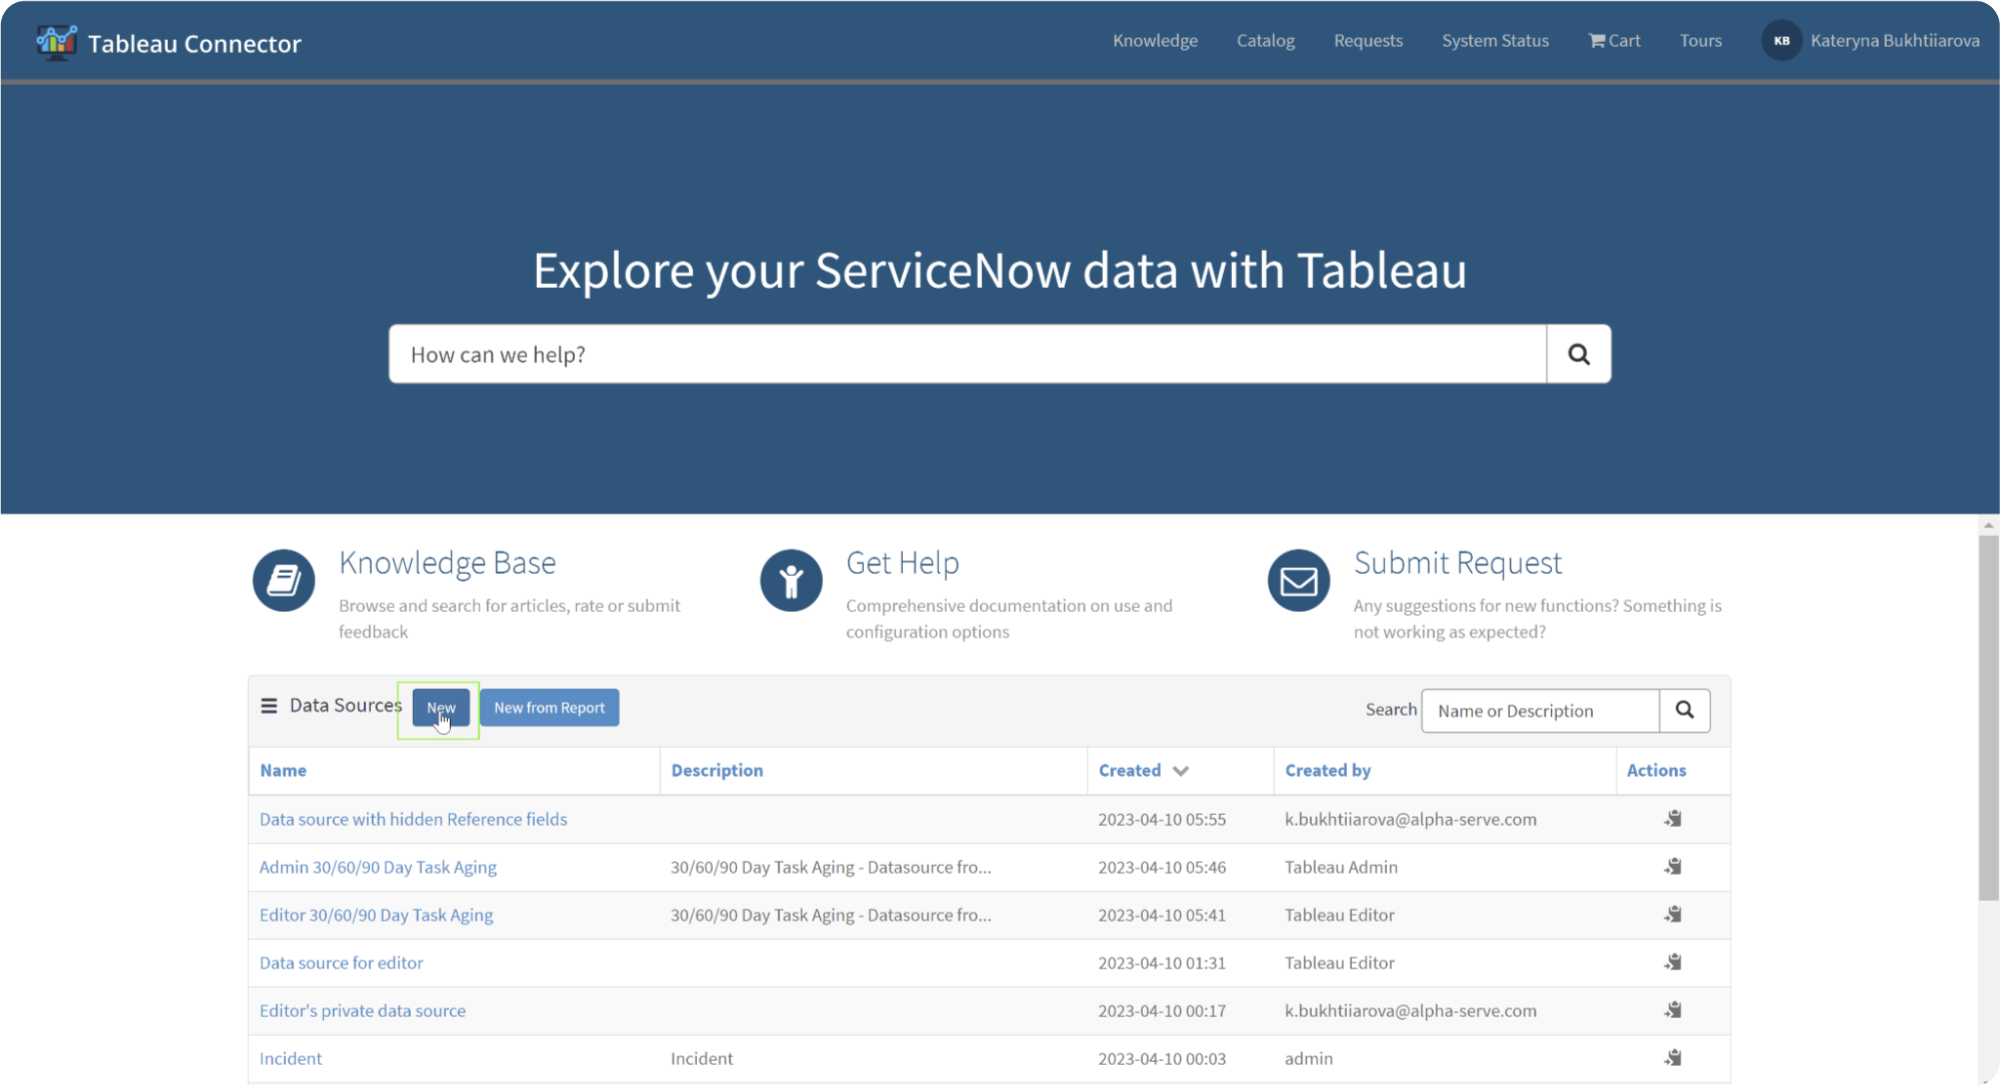
To create a Data Source using Tableau Connector for ServiceNow from the Instance-Name.service-now.com/tableau_connector, click “New.”
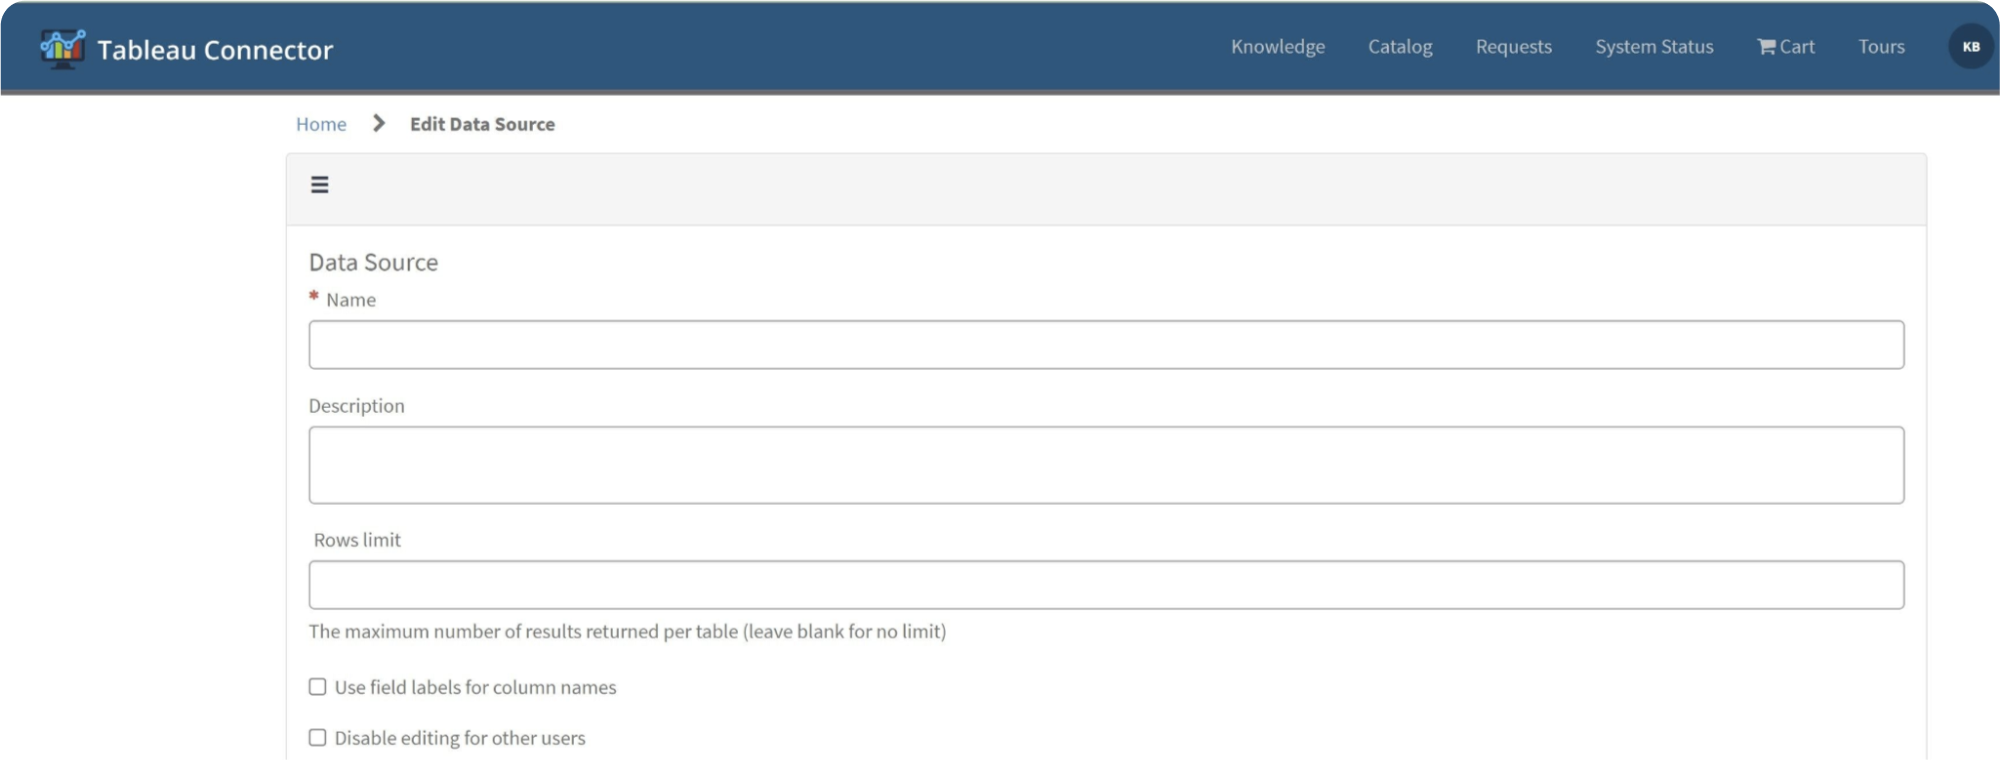
Provide a Data Source name and optionally add a description. Set the Rows limit and choose whether to use field labels for column names. Optionally, Disable editing for other users based on your preferences.
To add tables to your Data Source, click the “Add Table” button. Afterward, start typing the table name in the Search field, or scroll down the list to find the table.
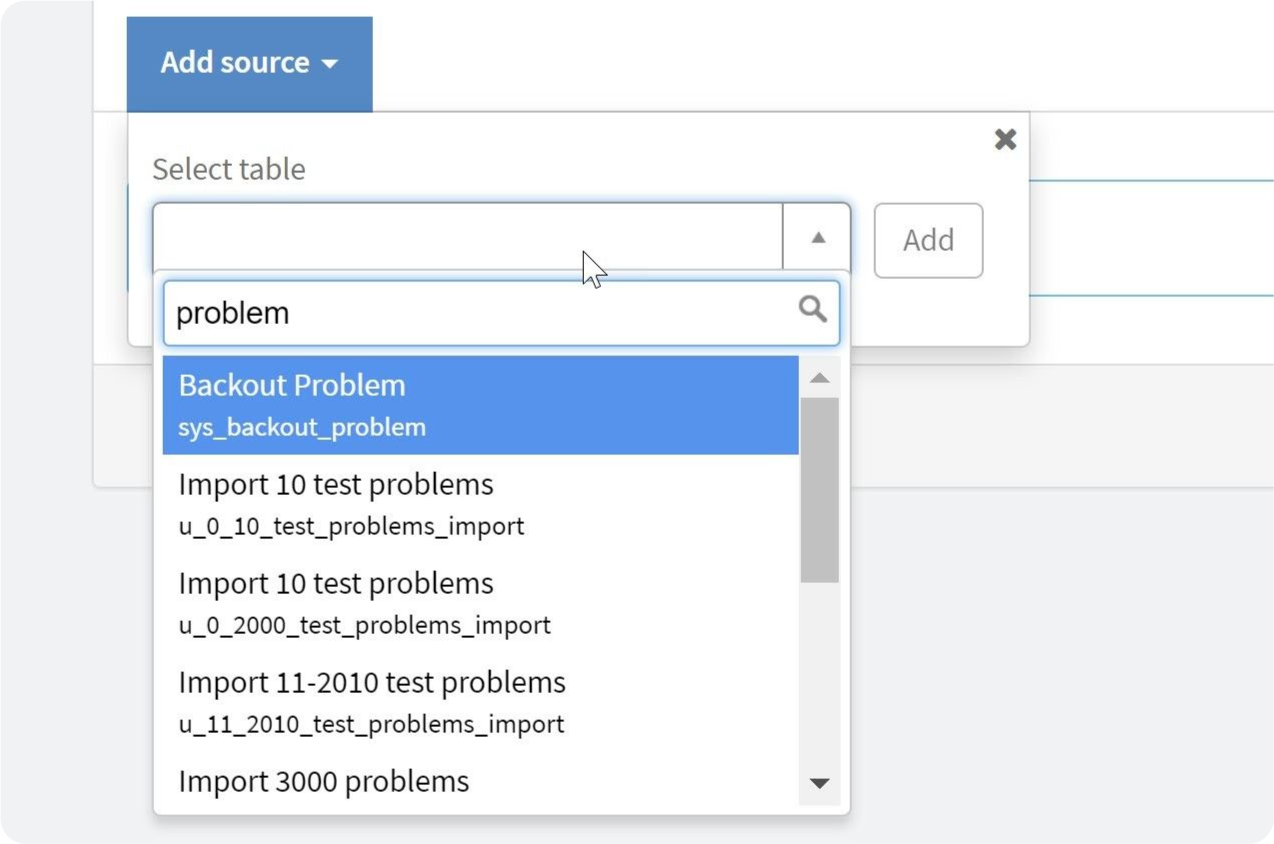
Once you have selected the desired table, click the “Add” button. All table fields will be selected by default, and no filters or Use display value switchers will be set. Feel free to include any number of tables and fields in your Data Source.
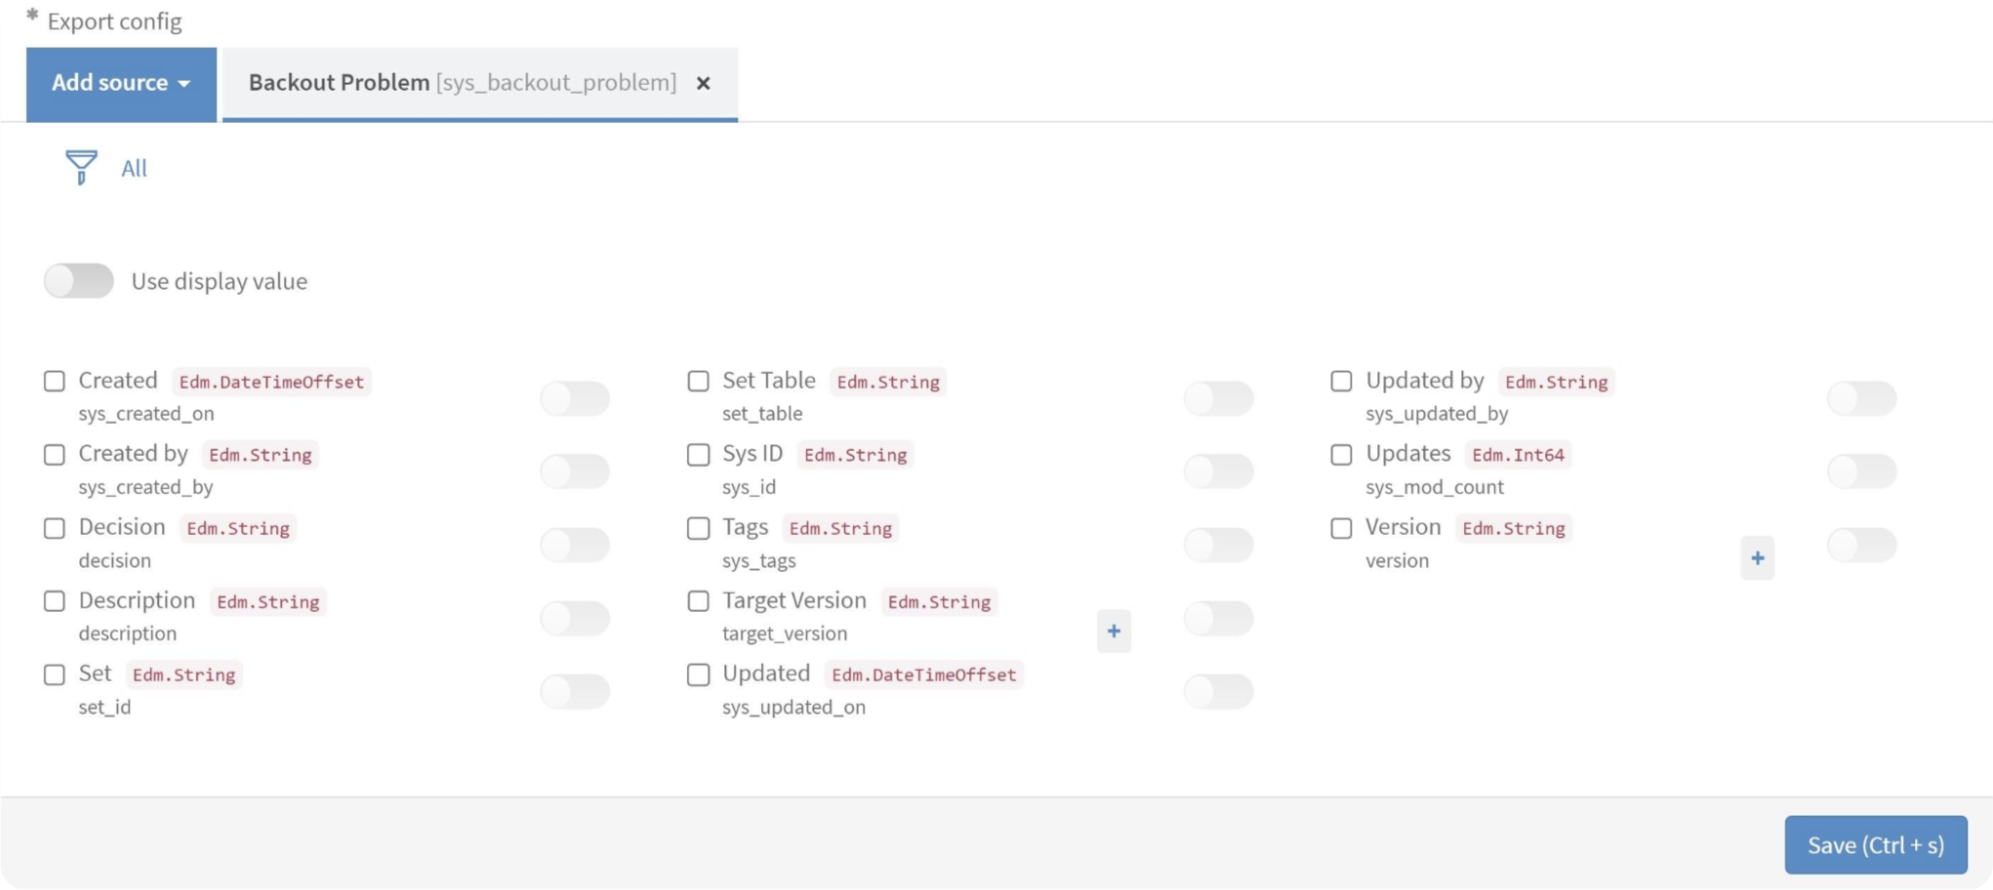
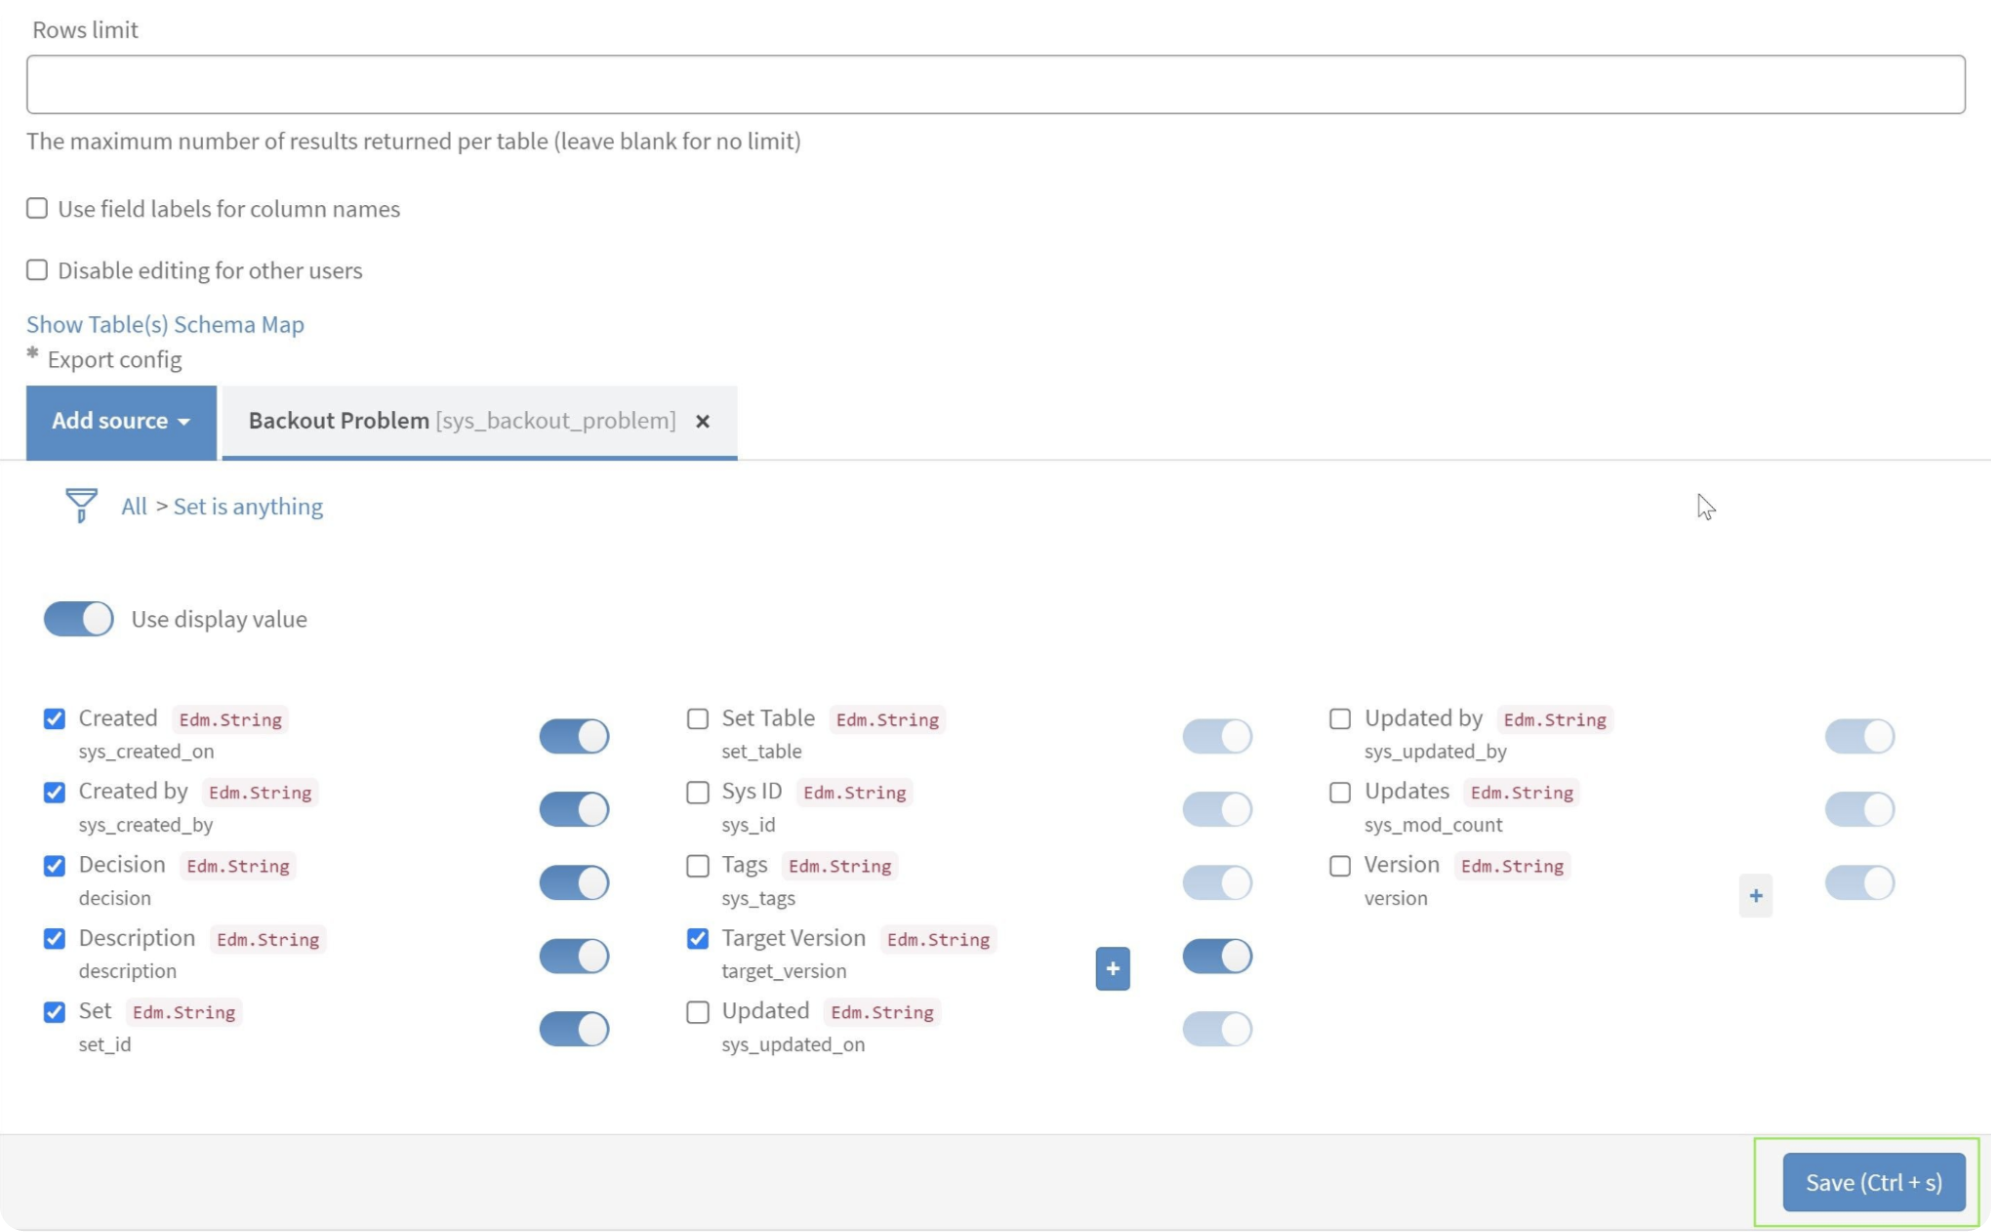
After adding the table to your Data Source, you can select the fields you need for your reports. It includes exporting any ServiceNow tables and fields, including Custom tables and fields.
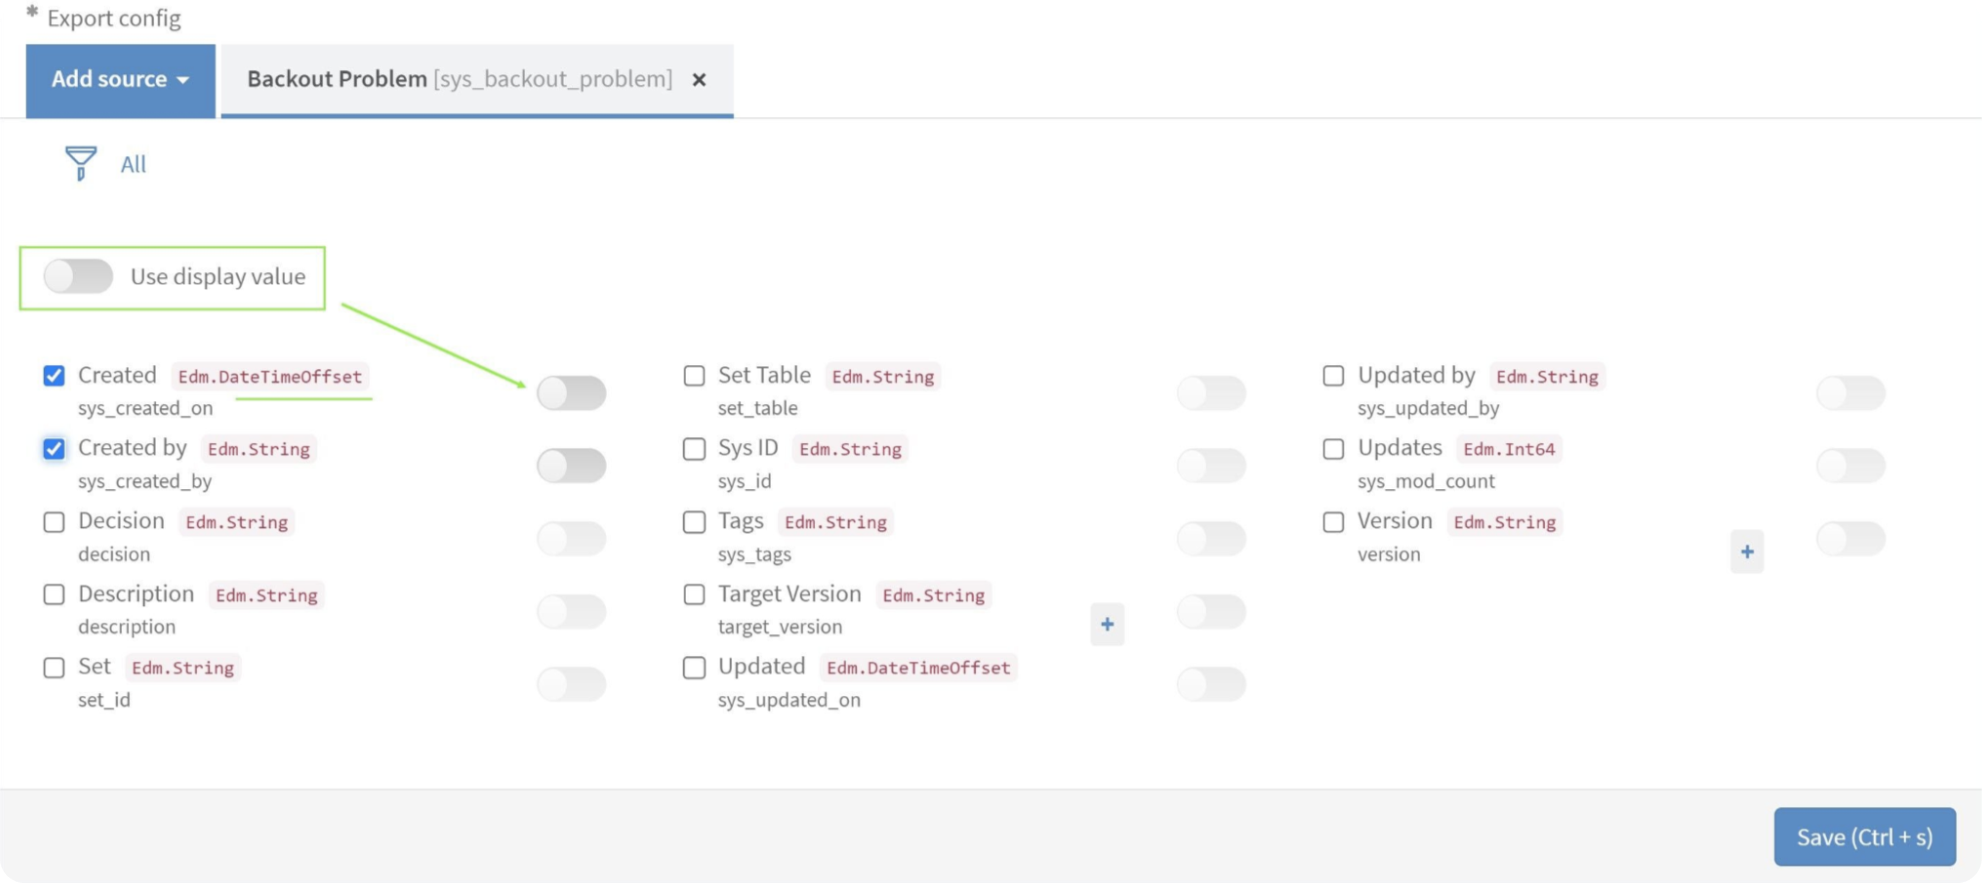
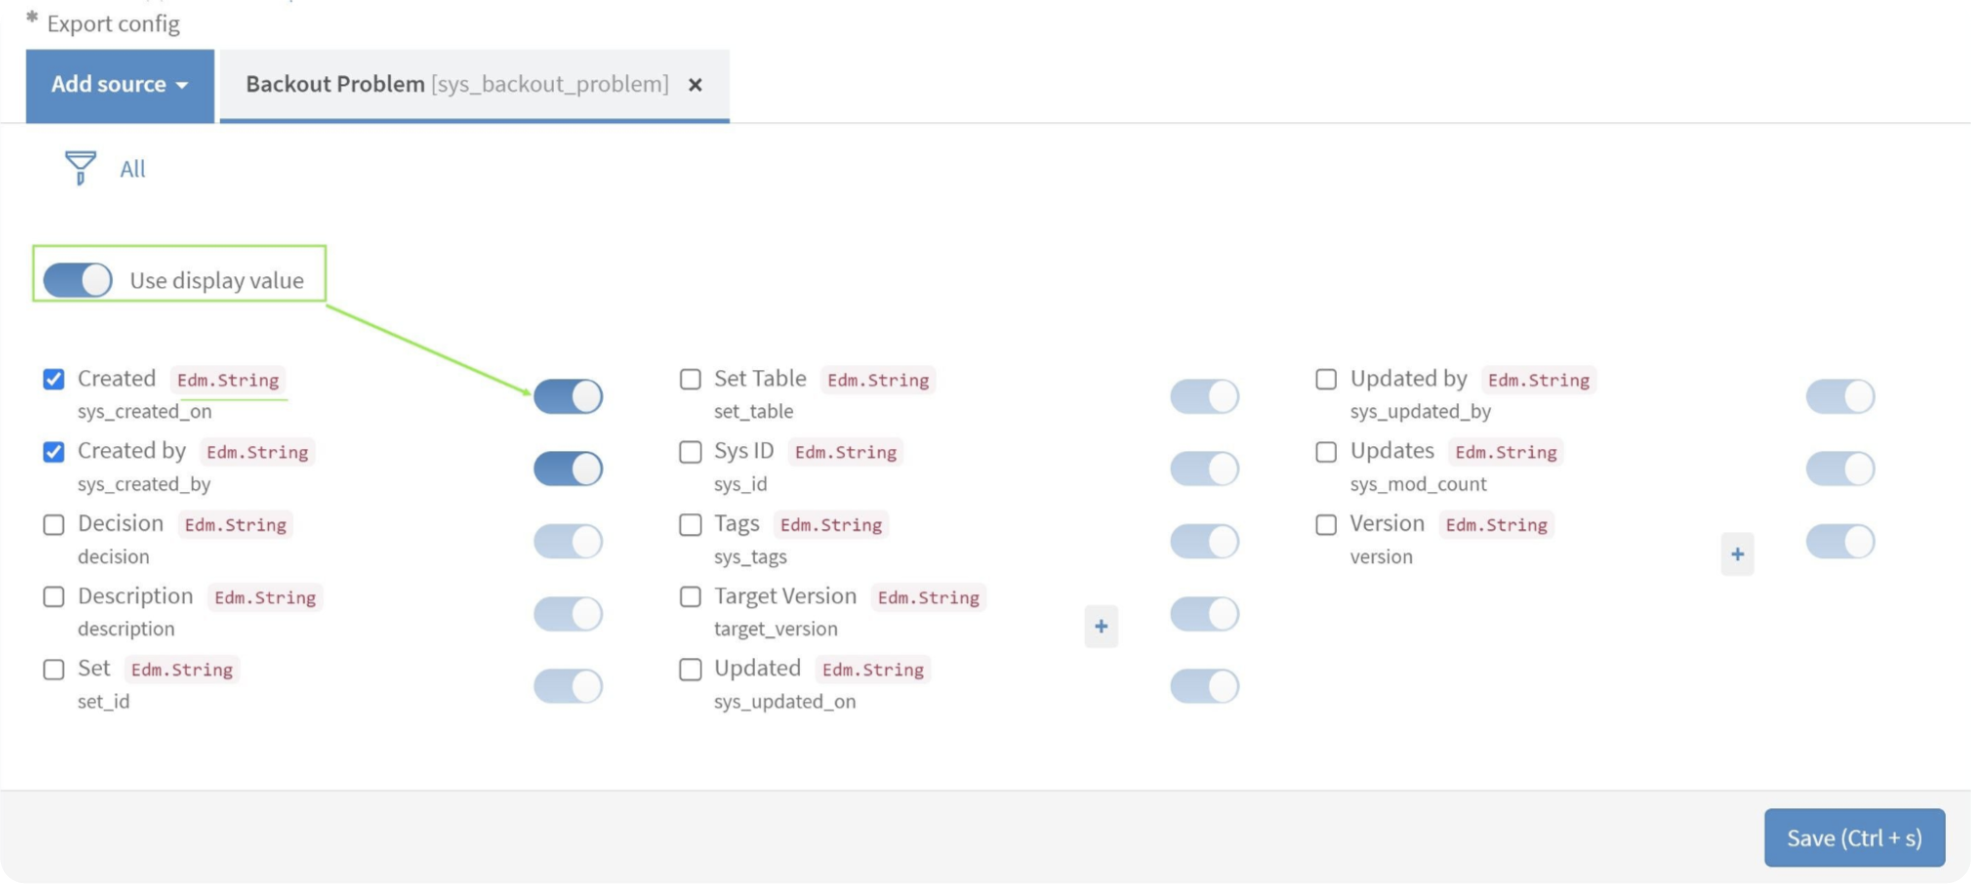
To set the display value for the exported data, you can turn on the “Use display value” option if you want the data exported in String format.
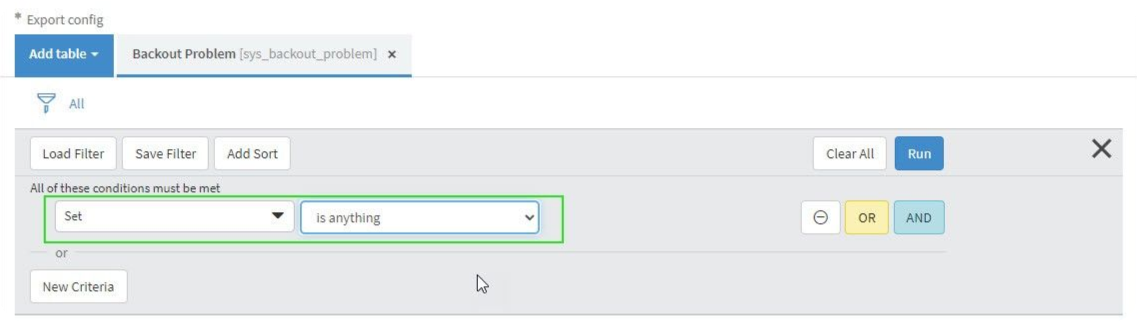
To refine the export results and focus on specific data, you can apply filters to the tables in Tableau Connector for ServiceNow. To configure a filter, click on the Filter icon and define the desired conditions for the filter.
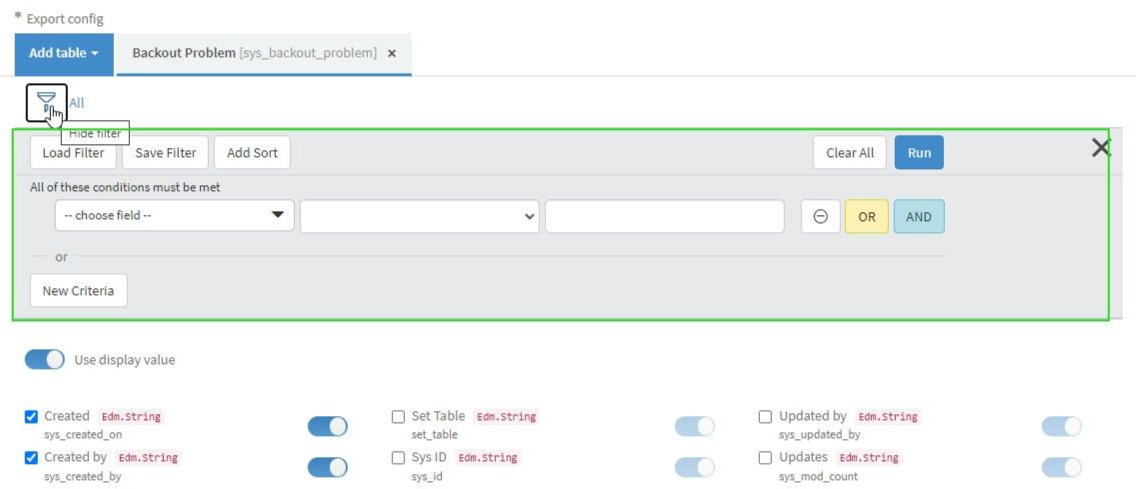
Add the necessary conditions and click the Run button to apply the filter. Once the filter is set, the export results will be limited to the data that meets the specified conditions, allowing for more targeted and relevant data analysis and reporting.
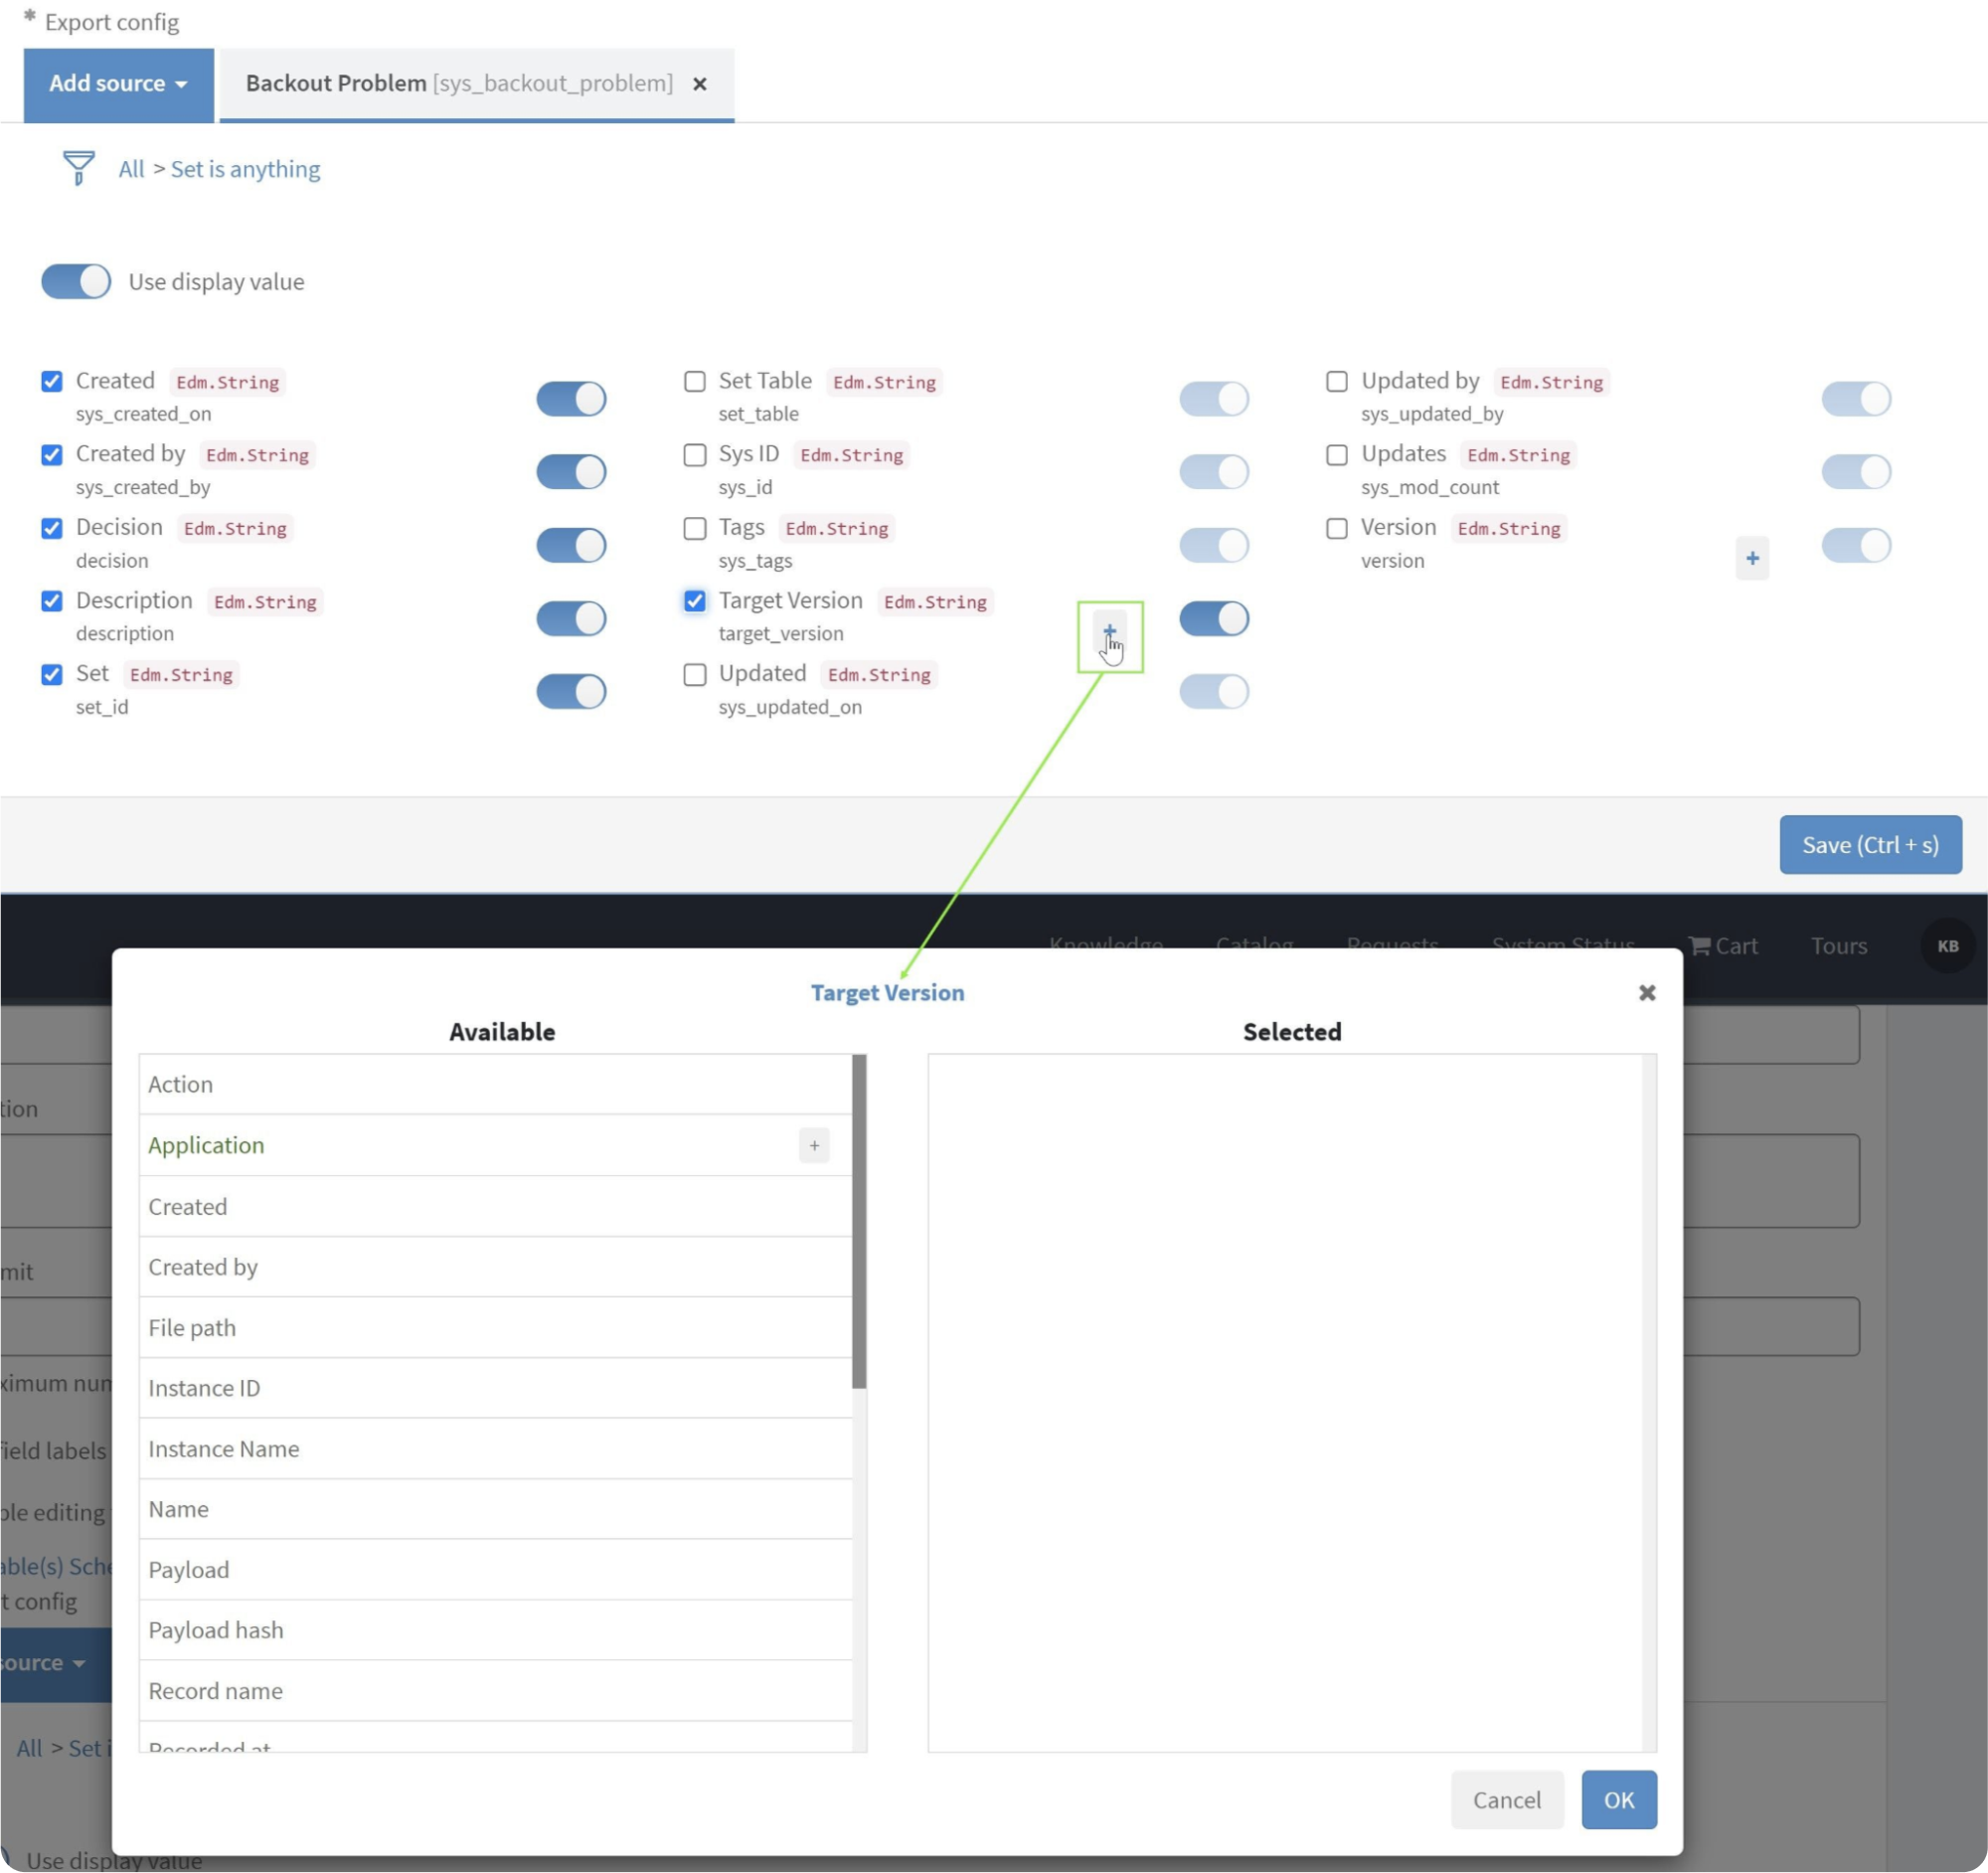
When dealing with tables that have fields of Reference type, you can include the referenced fields in the export process. To do this, click the “+” icon to open a dialog box. In the dialog box, select the referenced fields that you want to export. Once you have selected it, click OK to close the dialog box.
To save the data source you have configured, click the “Save” button at the bottom of the page. It will ensure that all your settings and selections for the data source are preserved and can be accessed for future use.
2. Export Data from ServiceNow to Tableau
From the Tableau Connector page at Instance-Name.service-now.com/tableau_connector, you can scroll down to locate the Data Sources table. In this table, you can find the specific data source you seek using the Search functionality. Enter the name or description of the data source in the search field, and the table will display the relevant results.
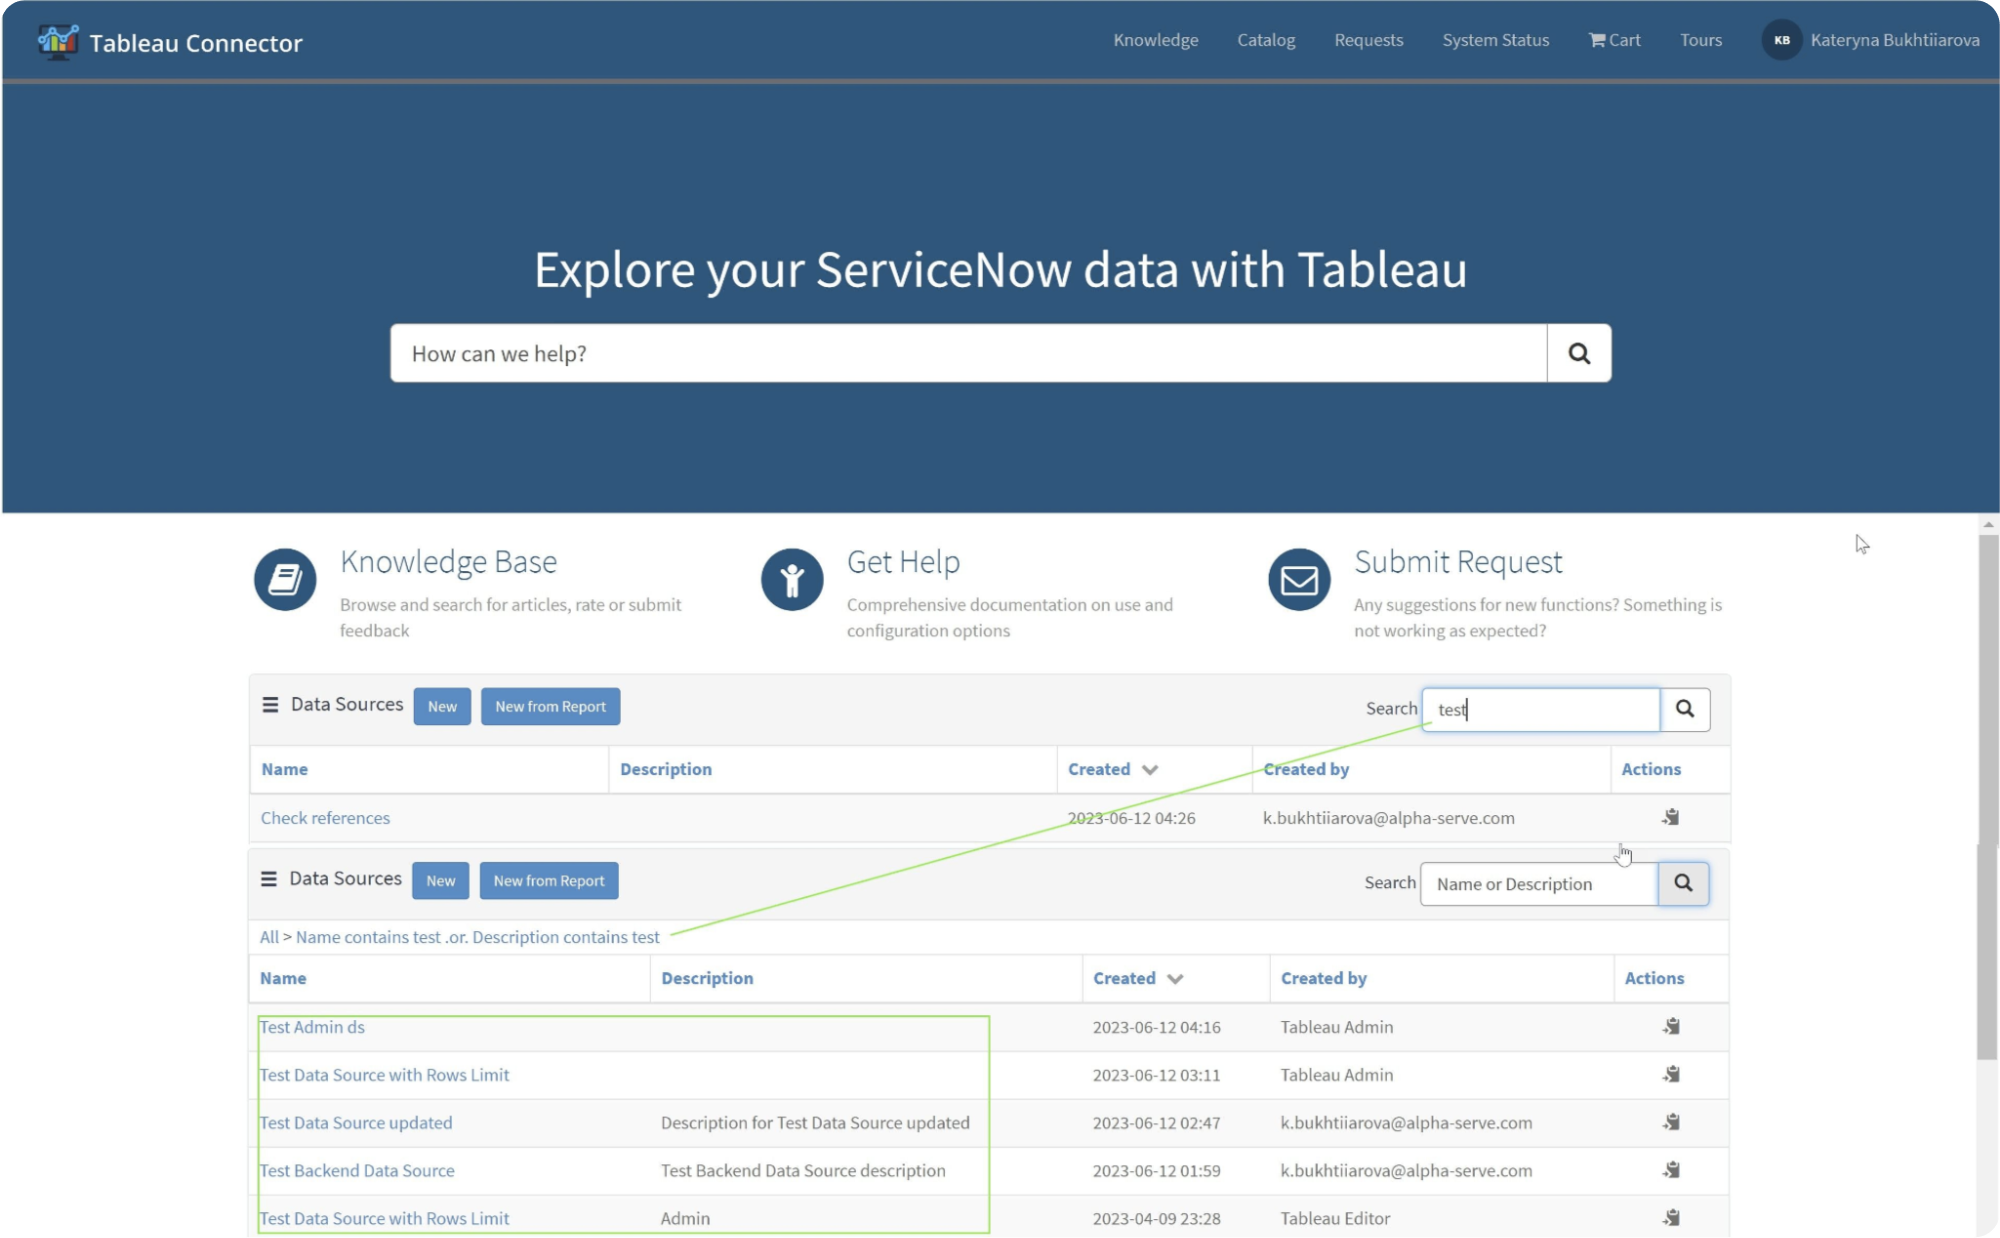
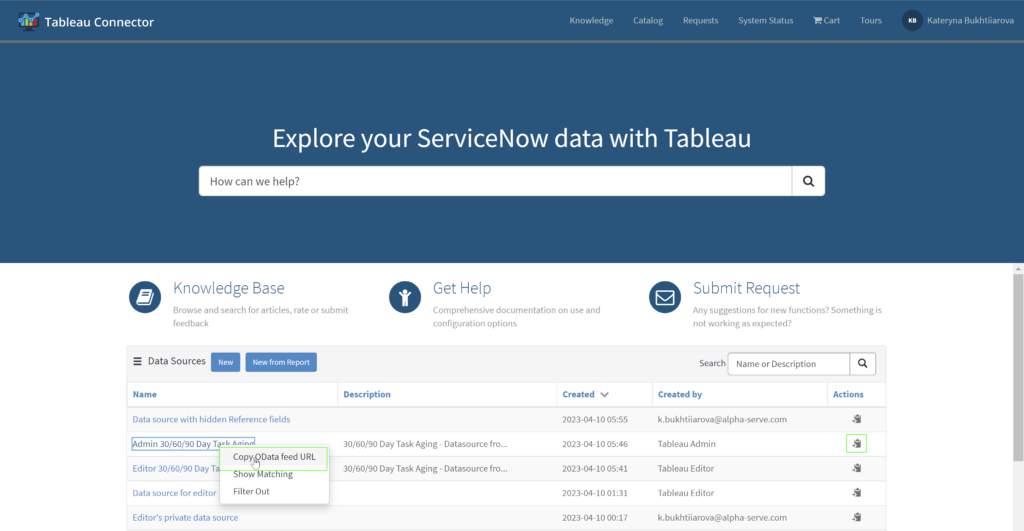
On the Tableau Connector page at Instance-Name.service-now.com/tableau_connector, you can find the desired data source in the list using the “Show Matching” or “Filter Out” filters to narrow down the results. Once you have located the data source, right-click it to open the menu.
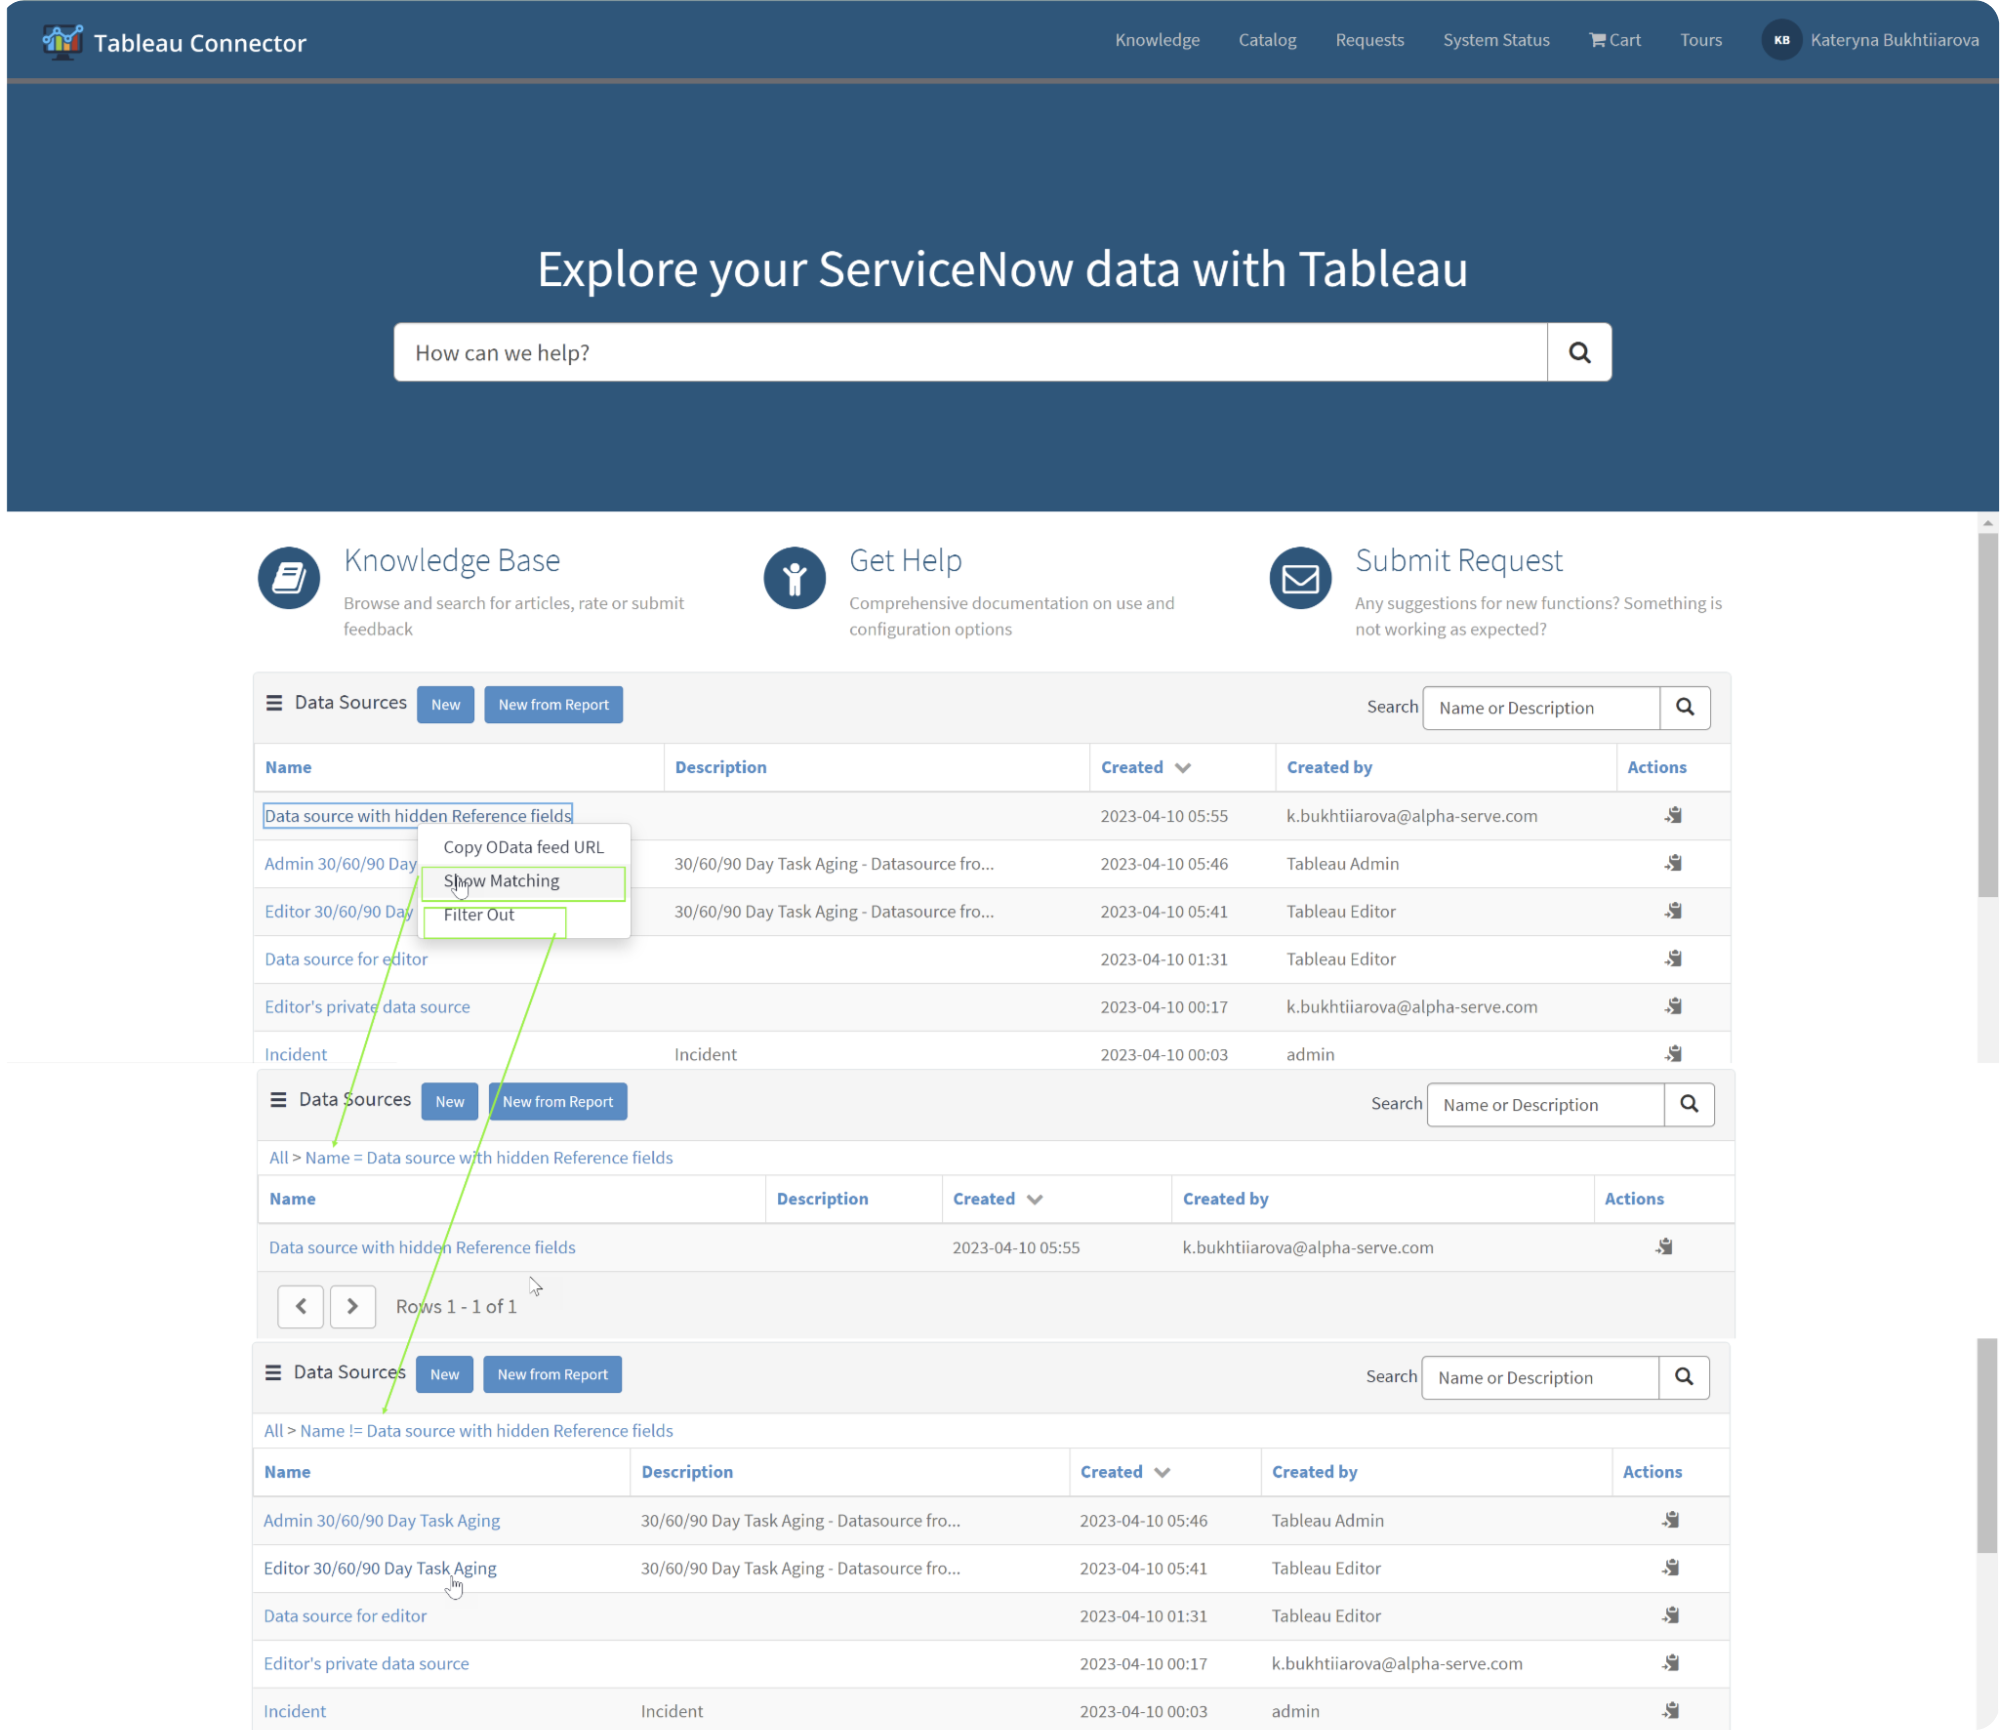
From the menu, you can choose the option “Copy OData feed URL” to copy the OData feed URL associated with that data source. Alternatively, you can use the direct “Copy” action next to each data source. It allows you to quickly obtain the OData feed URL for the selected data source, which can then be used for further integration and analysis with Tableau.
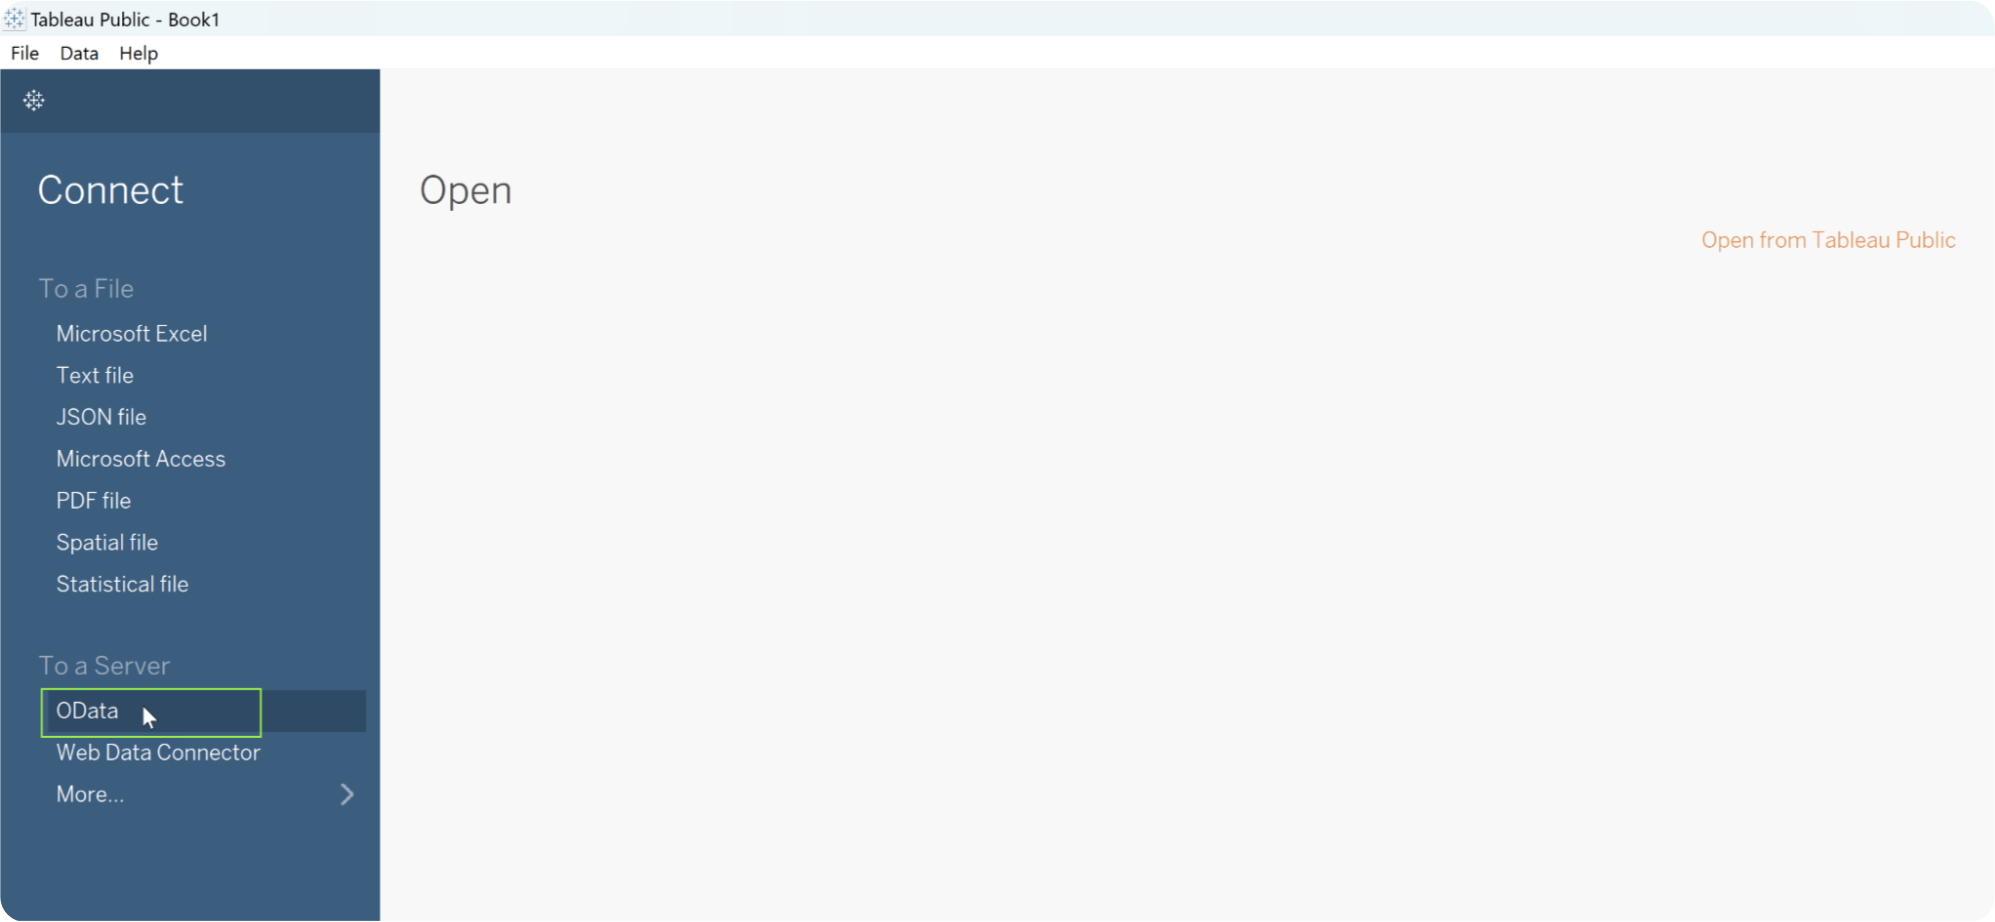
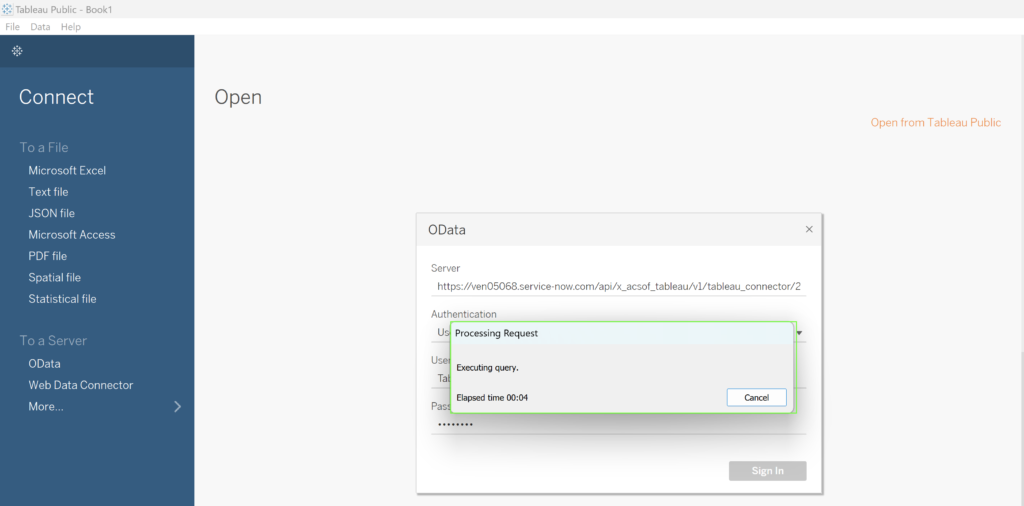
In the Tableau Desktop, select “OData” as the connection type.
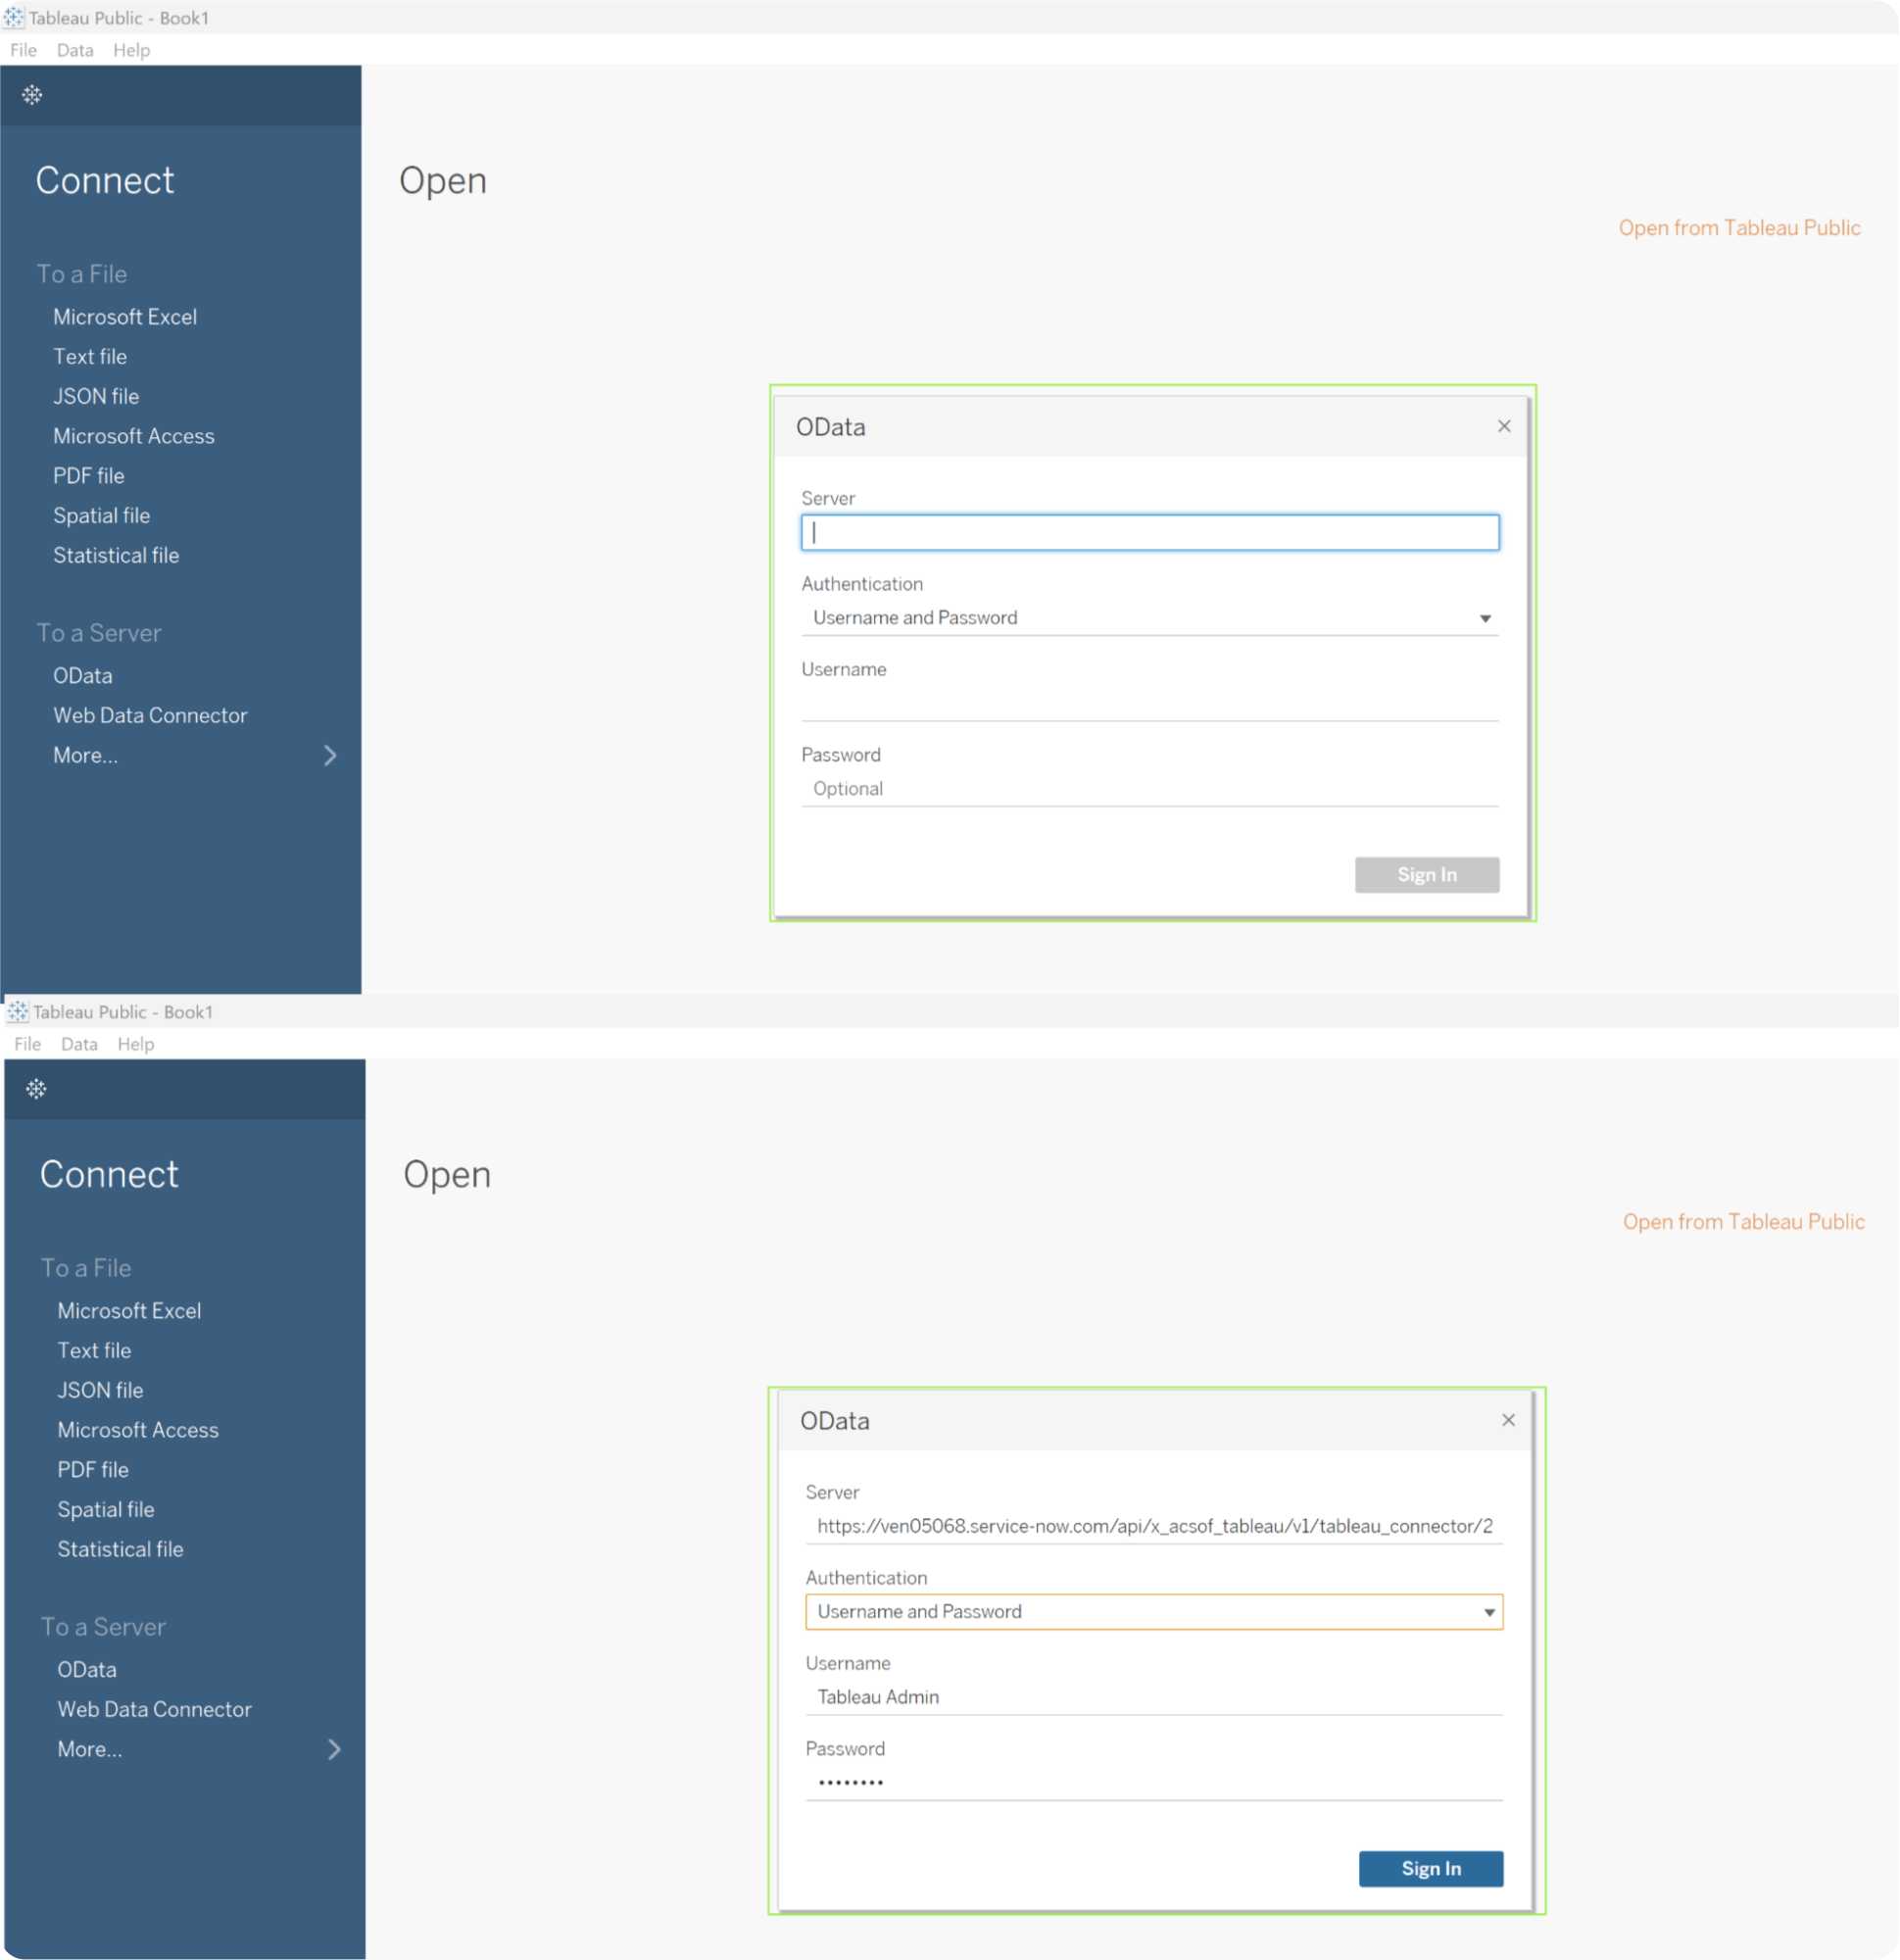
In the opened window, paste the copied OData URL from the Tableau Connector for ServiceNow into the “Server” field. Choose the “Username and Password” authentication type. Enter your username in the designated field. Enter your password in the provided field. Click the “Sign In” button to authenticate and establish the connection to the ServiceNow data source.
Once the import process is initiated, it will retrieve the data from the ServiceNow source. Once the import is complete, you can build View and visualizations using the imported data from ServiceNow.
Recap
A simple and effective method of connecting ServiceNow with Tableau is offered through the Tableau Connector for ServiceNow. The connector allows users to glean more significant insights from their ServiceNow data because of its user-friendly interface and flexible capabilities, including dot-walking for examining complex relationships and scheduled refreshes for keeping visualizations up to date. Organizations can produce thorough reports, develop dynamic dashboards, and make decisions based on data by combining the full power of ServiceNow and Tableau.
About acSoft Blog
No matter where you stand in your ServiceNow expertice, the acSoft blog is designed to support your growth and success. Beginners can find foundational knowledge to build a strong base, intermediates can refine their skills with advanced insights, and experts can stay at the forefront of innovation with our cutting-edge content. We’re committed to providing a holistic learning experience that not only educates but also inspires and empowers you to excel in your ServiceNow endeavors.