While ServiceNow reporting offers potent features out-of-the-box, enterprise-scale organizations often seek more comprehensive insights and customization options to align their intention with the precise analytical requirements. Microsoft Power BI emerges as a compelling choice for ServiceNow advanced reporting in this context. Organizations can leverage extensive Power BI data visualization tools and cutting-edge analytics capabilities to unlock more in-depth insights from their ServiceNow data, making value-adit strategizing and revealing new organizational opportunities.
This article explores why choose Power BI for enhancing ServiceNow reporting, offering unparalleled flexibility, customization, and actionable insights to meet the diverse needs of modern enterprises.
- What is ServiceNow Reporting (OOTB)
- Introducing Power BI for ServiceNow Advanced Reporting
- Why Use Power BI for ServiceNow Reporting
- How to Connect ServiceNow and Power BI
- ServiceNow Tips and Tricks for Effective Reporting in Power BI
- Recap
What is ServiceNow Reporting (OOTB)
ServiceNow Reporting Out of the Box (OOTB) contains a collection of pre-configured reporting features native to the ServiceNow platform, offering users immediate access to essential insights without requiring extensive customization or integration efforts. These OOTB reporting capabilities serve as dynamic visual representations of enterprise data, spanning critical functionalities such as incident management, service catalog requests, and key performance indicators (KPIs). Organizations can quickly generate, view, and apply ServiceNow report sharing reports across the enterprise through a user-friendly interface, facilitating data-driven decision-making and enhancing operational visibility.
Within the ServiceNow platform, users can explore OOTB reports to gain valuable insights into various aspects of their operations. For example, incident management reports provide detailed information on reported incidents’ volume, status, and resolution times, enabling IT teams to identify trends, prioritize tasks, and improve service delivery. Similarly, service catalog request reports offer visibility into service request volumes, fulfillment times, and user satisfaction metrics, empowering organizations to optimize service delivery processes and enhance customer experience.
One of the key advantages of ServiceNow OOTB reports is its accessibility and ease of use. Users can quickly access pre-configured reports through the ServiceNow interface, eliminating the need for extensive training or technical expertise. Additionally, ServiceNow report sharing is possible across the organization via dashboards, emails, and service portals, ensuring that relevant stakeholders can access timely and actionable insights.
Furthermore, ServiceNow reporting feature enables users to customize reports according to their requirements. While the platform provides a wide selection of pre-configured reports, users have the flexibility to create a report in ServiceNow that fits their unique workflows and business needs. This customization capability allows organizations to focus on the metrics and KPIs that matter most to them, ensuring that reports deliver actionable insights aligned with strategic objectives.
Despite the many benefits of ServiceNow OOTB reports, there may be challenges, particularly for enterprise-scale organizations. These challenges may include limitations in creating complex reports, concerns about data quality, and performance degradation issues stemming from extensive report usage. However, the Now Platform continuously updates and enhances its reporting capabilities to address these challenges and meet the evolving needs of its users.
Limitations of Native ServiceNow Reporting Tools
Although ServiceNow offers out-of-the-box reporting capabilities, they frequently fall short for organizations that require deeper and next-level insights.
- Limited Data Scope
ServiceNow’s native reporting tools are restricted to data within its ecosystem, presenting a significant limitation for organizations that require integrated insights from various sources. This limitation hinders the ability to generate comprehensive reports that reflect the broader business context, potentially leading to decision-making that is not fully informed.
- Snapshot-Based Reporting
The platform’s default reporting functionalities focus primarily on the current state of data, lacking the capability for practical historical analysis. This design choice limits users’ ability to observe trends over time unless they resort to manual data manipulation, which can be time-consuming and prone to errors.
- Large Data Set Challenges
ServiceNow’s reporting features often underperform when dealing with substantial data volumes, impacting system efficiency. Processing large data sets can slow down database queries, leading to longer wait times and a less responsive user experience. This performance degradation can be particularly problematic during peak business hours.
- Reporting Delays and Operational Impacts
Generating reports in ServiceNow can strain its operational capacity, potentially affecting other functionalities. Organizations might find themselves scheduling report generation during off-hours to mitigate this issue. However, even then, extensive reports might exceed time limits, failing to be ready when needed, thus affecting business processes reliant on timely data.
- Accessibility for Non-Licensed Users
ServiceNow’s reporting is only operational within its platform, limiting access for individuals without ServiceNow credentials. Consequently, sharing insights with non-licensed stakeholders is cumbersome, often leading businesses to employ additional tools or risky practices like credential sharing to circumvent this limitation, posing potential security risks.
Introducing Power BI for ServiceNow Advanced Reporting

Microsoft Power BI is a robust business analytics tool renowned for its ability to transform diverse data sources into dynamic dashboards and reports. It empowers users to visualize data, share insights across organizations, and embed them seamlessly into applications or websites. With its extensive data integration capabilities, processing power, and advanced analytics tools, Power BI enables businesses to leverage their data effectively for informed decision-making.
ServiceNow, a leading IT service management platform, generates valuable data across various organizational processes. By integrating ServiceNow with Power BI, organizations can elevate their data analysis to a new level, particularly in the realm of advanced reporting and analytics.
Let’s explore how this integration enhances ServiceNow reporting by transforming complex, often unstructured data into actionable intelligence.
Comprehensive Data Analysis
Power BI’s integration with ServiceNow allows for comprehensive data analysis by aggregating information from multiple sources. This integration provides users with a holistic view, combining ServiceNow’s internal metrics with external data to gain deeper insights.
Tailored Analytics
Create custom reports focusing on specific KPIs or performance metrics within ServiceNow. Power BI’s detailed analytical tools enable deep dives into areas like incident management efficiency or service level compliance, providing clear insights for targeted improvements.
Advanced Data Visualization
Power BI offers a wide array of data visualization types beyond standard charts. From heat maps to tree maps and custom visuals tailored to organizational needs, users can explore advanced visualization options to gain deeper insights into ServiceNow data.
Real-Time and Incremental Data Refresh
Thanks to the Power BI incremental refresh feature, stay updated with the latest data. Ensure your decision-making is based on the most current data without overloading your system with full-data refreshes.
Why Use Power BI for ServiceNow Reporting
Why choose Power BI? ServiceNow provides fundamental IT service management data, but its built-in reporting has limitations. To overcome this, you can integrate Microsoft Power BI and ServiceNow for better analytics and visualization capabilities.
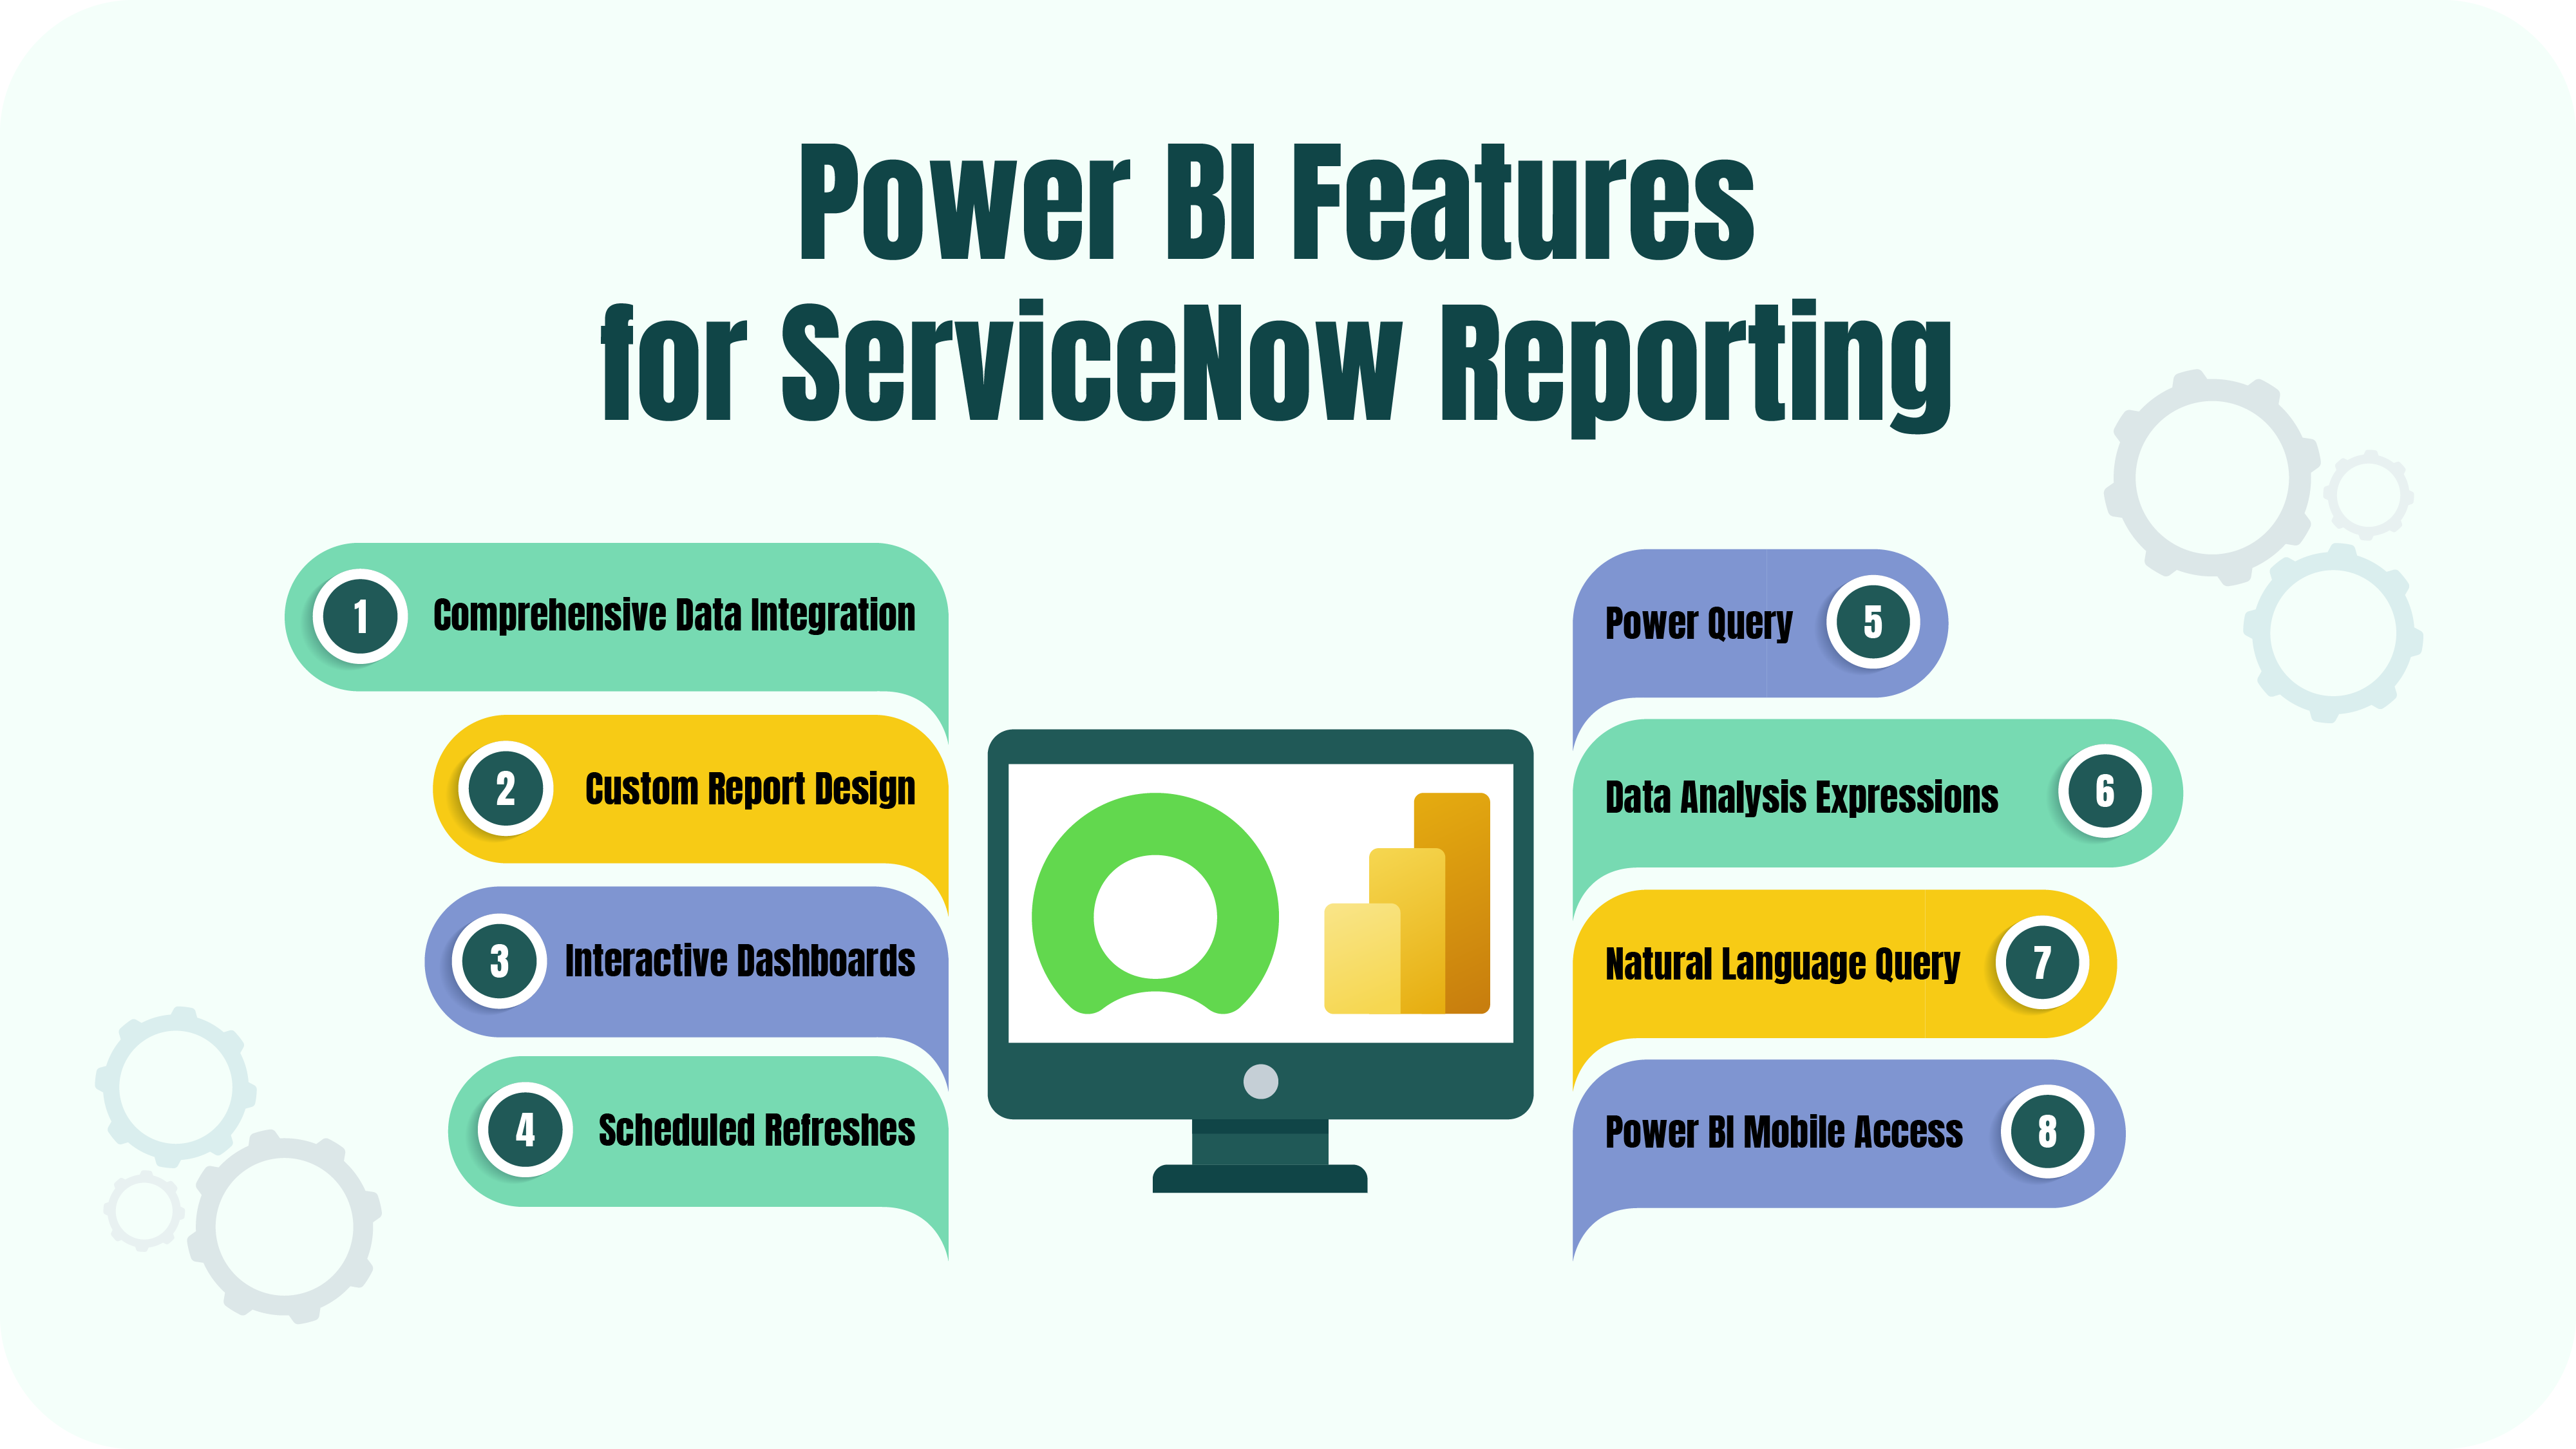
Overview of Power BI Features for ServiceNow Reporting
- Comprehensive Data Integration: Power BI enables seamless merging of ServiceNow data with various Microsoft solutions like Excel, Azure, and SQL Server, creating a unified data management, analysis, and visualization environment, enhancing the overall data handling and reporting experience.
- Custom Report Design: The platform provides extensive design options, allowing users to tailor reports to organizational objectives, transforming data into meaningful insights that resonate with stakeholders.
- Interactive Dashboards: Power BI’s interactive dashboards facilitate an engaging data exploration experience, promoting a deeper understanding of the data and fostering an interactive analytical environment.
- Scheduled Refreshes: With automated refresh capabilities, Power BI ensures that ServiceNow reports are always up-to-date, supporting accurate and timely decision-making processes.
- Power Query: Power BI incorporates Power Query, a functional feature for altering and refining data. It enables users to seamlessly link to different data sources, cleanse and modify the data, and then integrate it into Power BI for further examination.
- Data Analysis Expressions (DAX): Power BI provides the functionality to establish links between tables, create computed columns, and formulate measures using Data Analysis Expressions (DAX), crafting comprehensive data structures. This functionality is key in generating detailed and meaningful reports.
- Natural Language Query: Power BI Q&A feature supports queries in natural language, enabling users to explore their data by posing questions in straightforward, conversational language. It enhances the user experience by making data analysis more accessible and engaging.
- Power BI Mobile Access: With apps for iOS and Android, Power BI enables users to view reports and dashboards from anywhere, ensuring constant connectivity and up-to-date information access on the go.
Power BI Comparison with Built-In ServiceNow Reporting Capabilities
Choose ServiceNow OOTB Reporting
- For exclusive analysis within the ServiceNow ecosystem using ServiceNow data.
- When manual data handling is sustainable and does not compromise data integrity.
- If the ServiceNow Report Builder meets their specific reporting requirements.
- When in-house expertise in Jelly and JavaScript is available for complex report development.
Choose Power BI for ServiceNow Reporting
- To perform in-depth analyses on specific segments using complex KPIs and metrics.
- For advanced, customized reporting and visualization that incorporates multiple data sources.
- To utilize a broad spectrum of report types and visualizations.
- To democratize data access within ServiceNow, enabling self-service reporting across user levels.
- To leverage the advantages of incremental dashboard refreshes and access real-time data for prompt insights.
Power BI vs Other BI Tools
While Power BI and Tableau are both market leaders in the business intelligence domain, several distinct features contribute to Power BI’s slight preference among users, as highlighted by Gartner’s data. Read our blog post for a more detailed Tableau vs Power BI comparison. How is Power BI different from other BI tools? Power BI distinguishes itself from other BI tools through its seamless integration with the Microsoft ecosystem, enhancing compatibility and convenience for users of Microsoft products. It offers a competitive edge in pricing, making it an attractive choice for a range of businesses, especially small to medium-sized enterprises. The platform’s user-friendly interface and lower learning curve facilitate quicker adoption and productivity. Power BI’s robust security features and regular updates ensure it remains a secure and cutting-edge tool for business intelligence needs. Its extensive data connectivity options and strong community support further establish Power BI as a preferred choice in the BI tool market.
How to Connect ServiceNow and Power BI

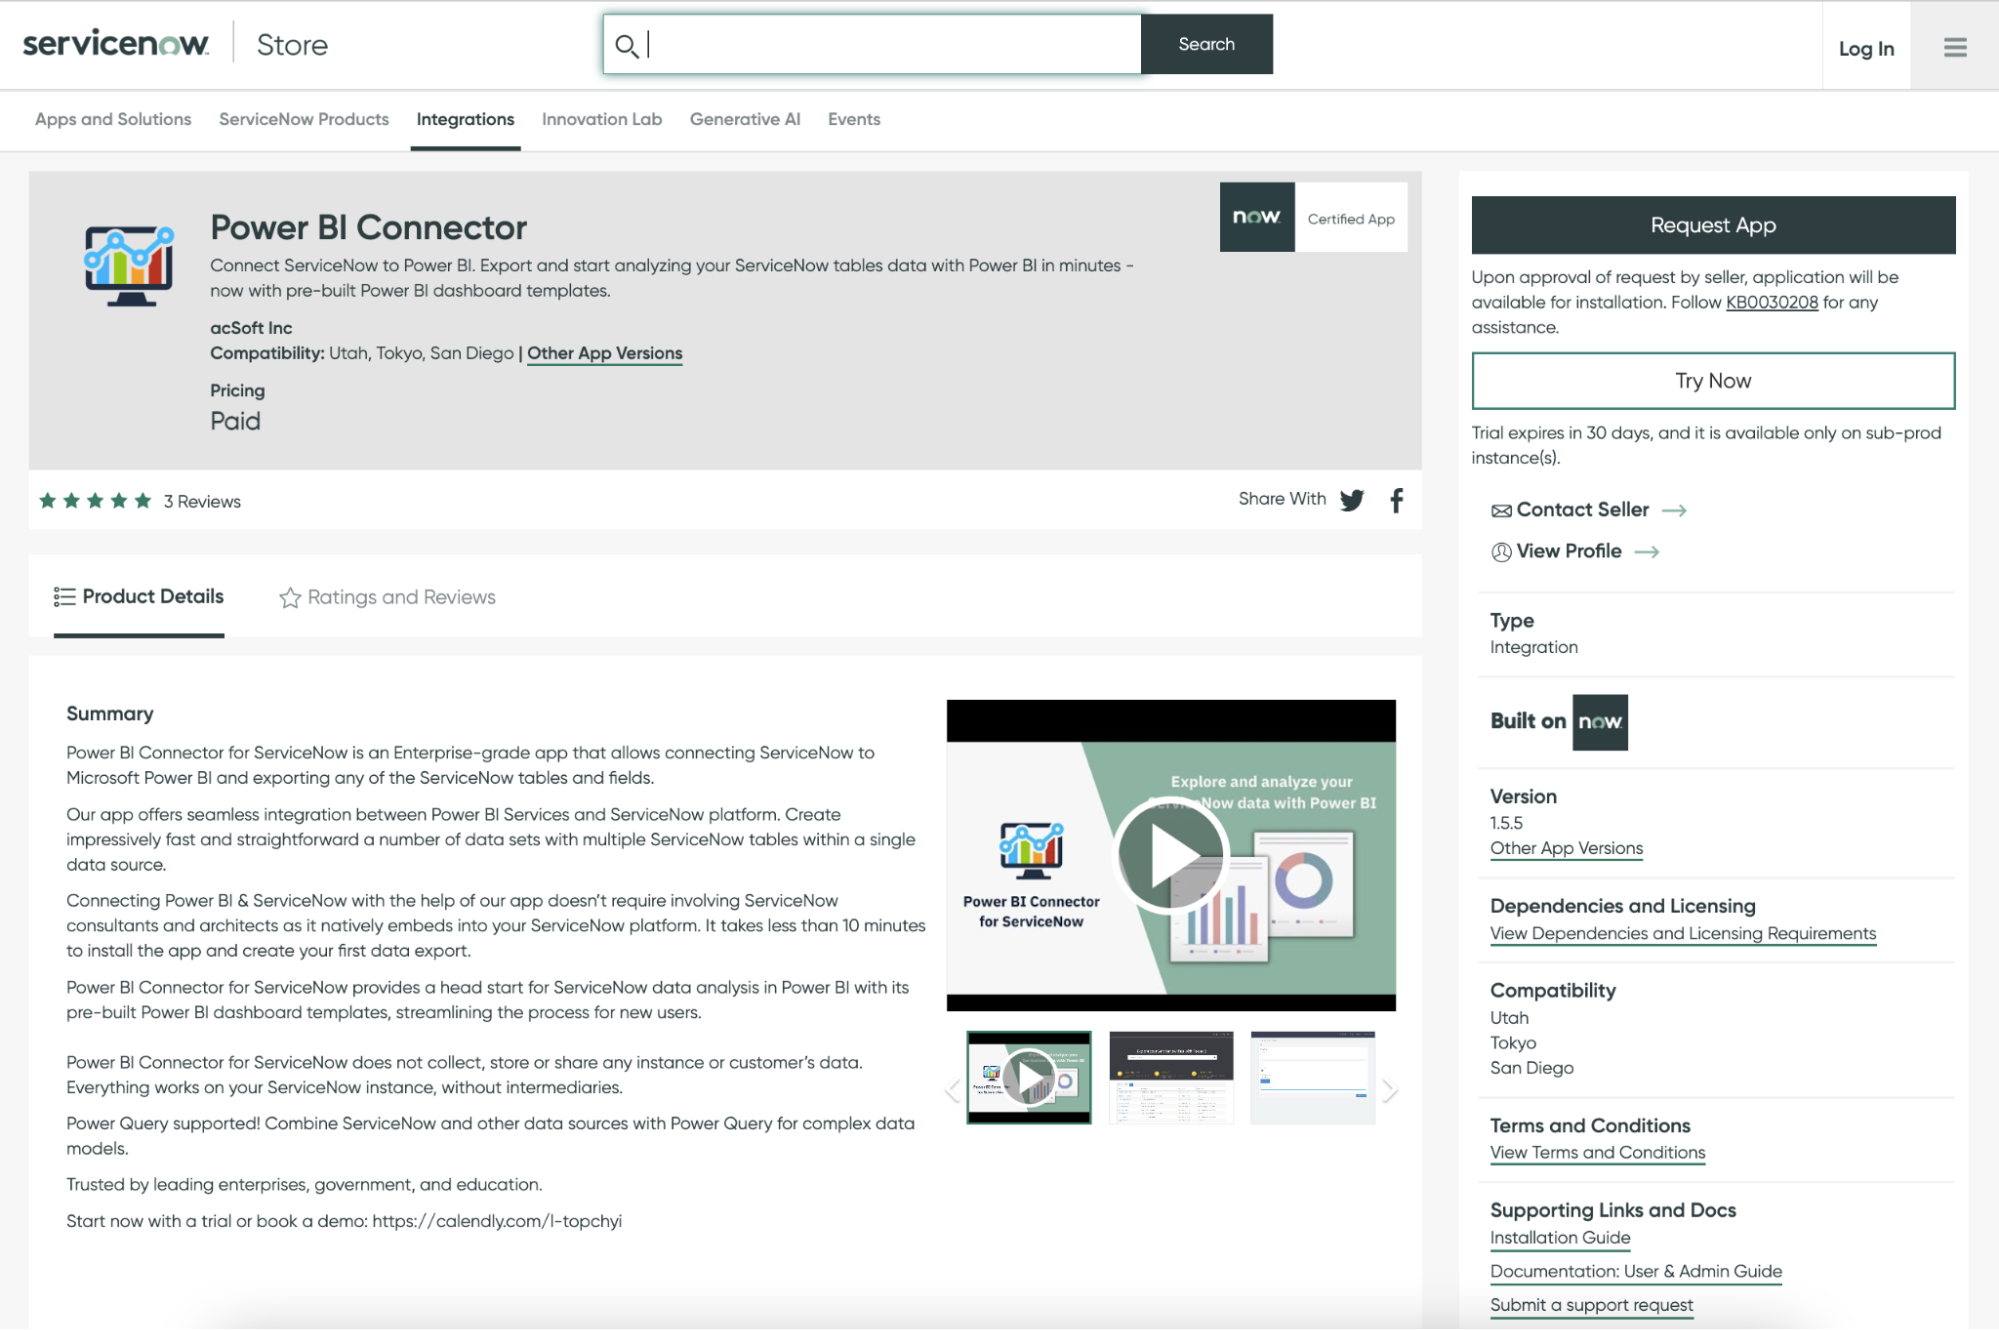
To leverage Power BI for ServiceNow reporting, the primary hurdle lies in exporting ServiceNow data to Power BI. However, this challenge is easily overcome with the Power BI Connector for ServiceNow. Specifically designed to seamlessly export ServiceNow data to Power BI, this connector operates autonomously, requiring no special prerequisites, thereby simplifying the process. As a Now Certified App, it is seamlessly integrated into the ServiceNow platform, guaranteeing alignment with ServiceNow’s standards, capabilities, and user interface, ensuring a smooth and efficient user experience.
To connect ServiceNow to Power BI, follow these steps:
Step 1: Install Power BI Connector for ServiceNow
- Log in to your ServiceNow instance.
- Search for “Power BI Connector for ServiceNow” in the ServiceNow Store.
- Install the connector and provide the necessary permissions.
Step 2: Create a Data Source in ServiceNow
- Ensure you have the PBI ADMIN or PBI EDITOR role.
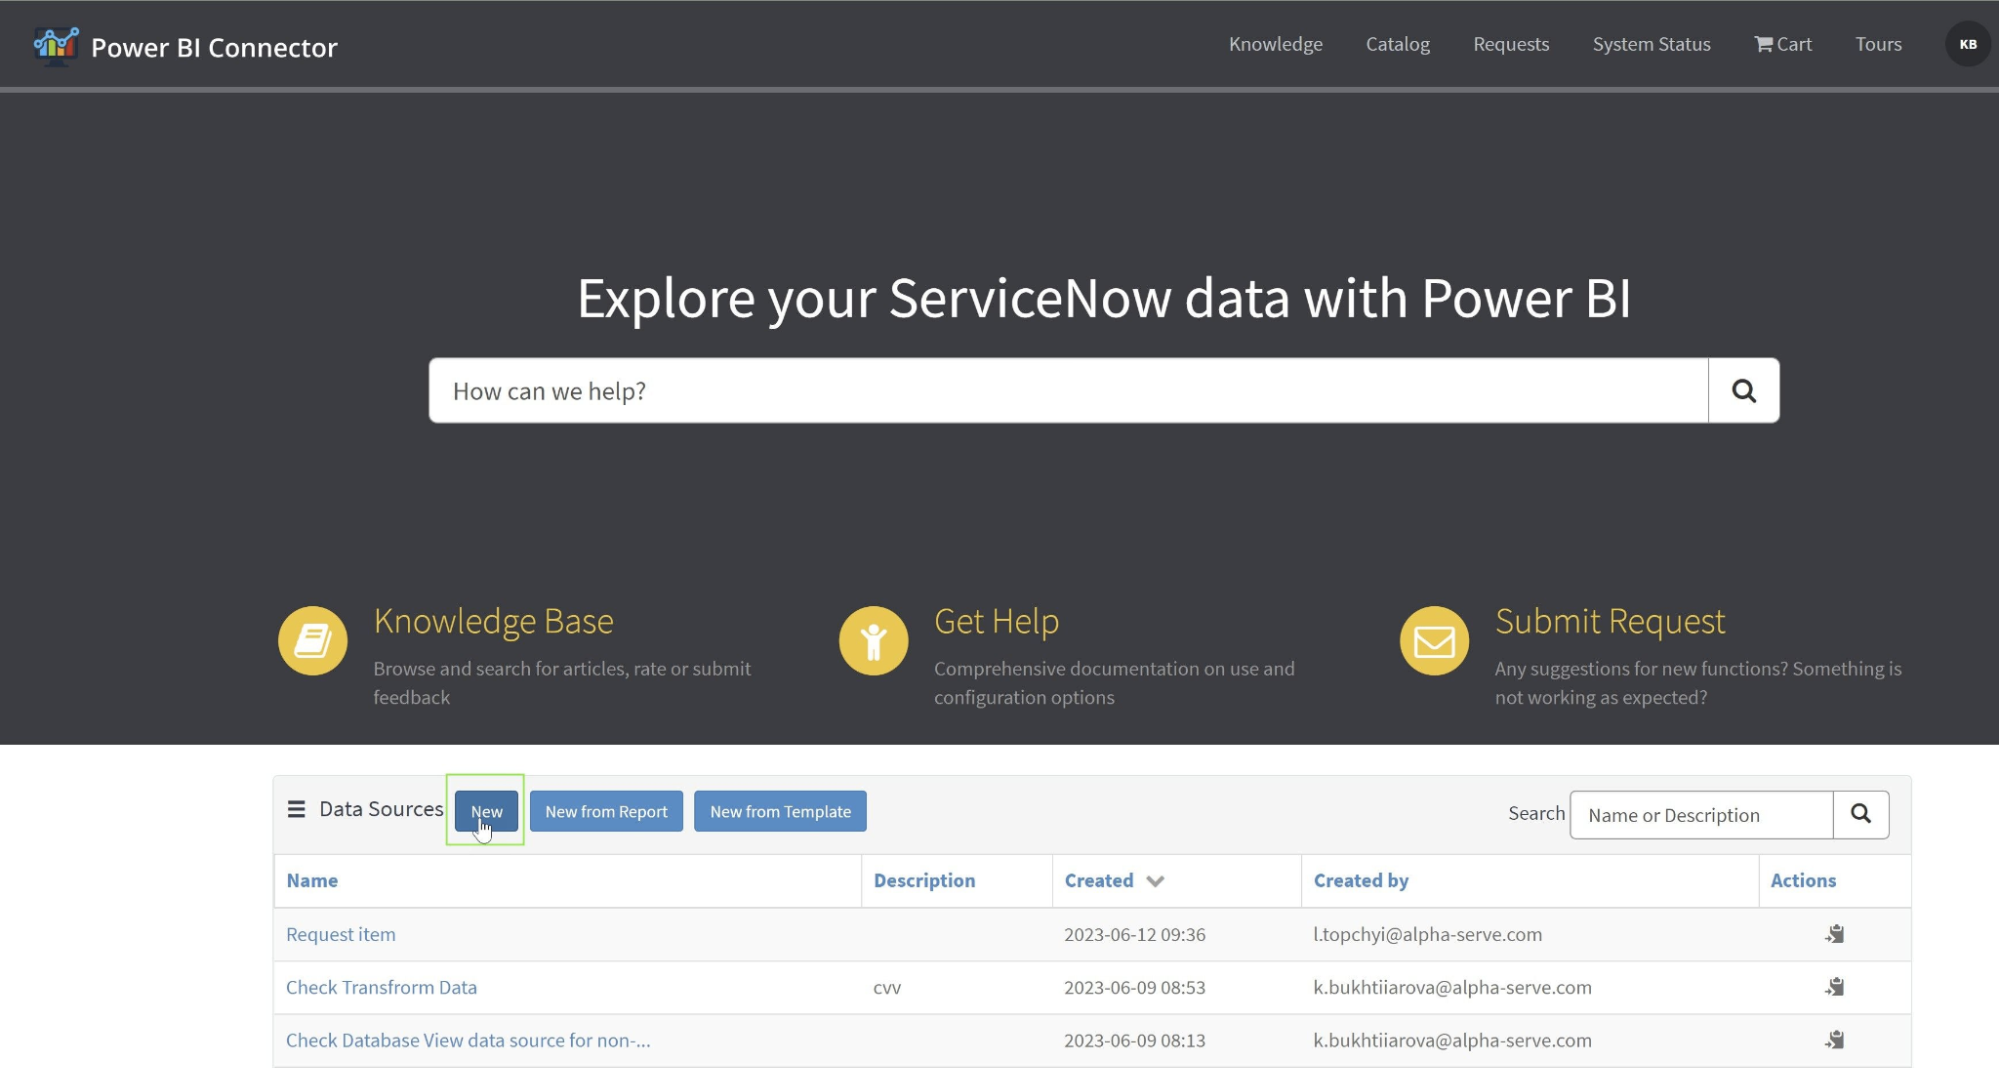
- From the Service Portal (Instance-Name.service-now.com/sp):
- Scroll down to find the Data Sources table. Click on the “New” button.
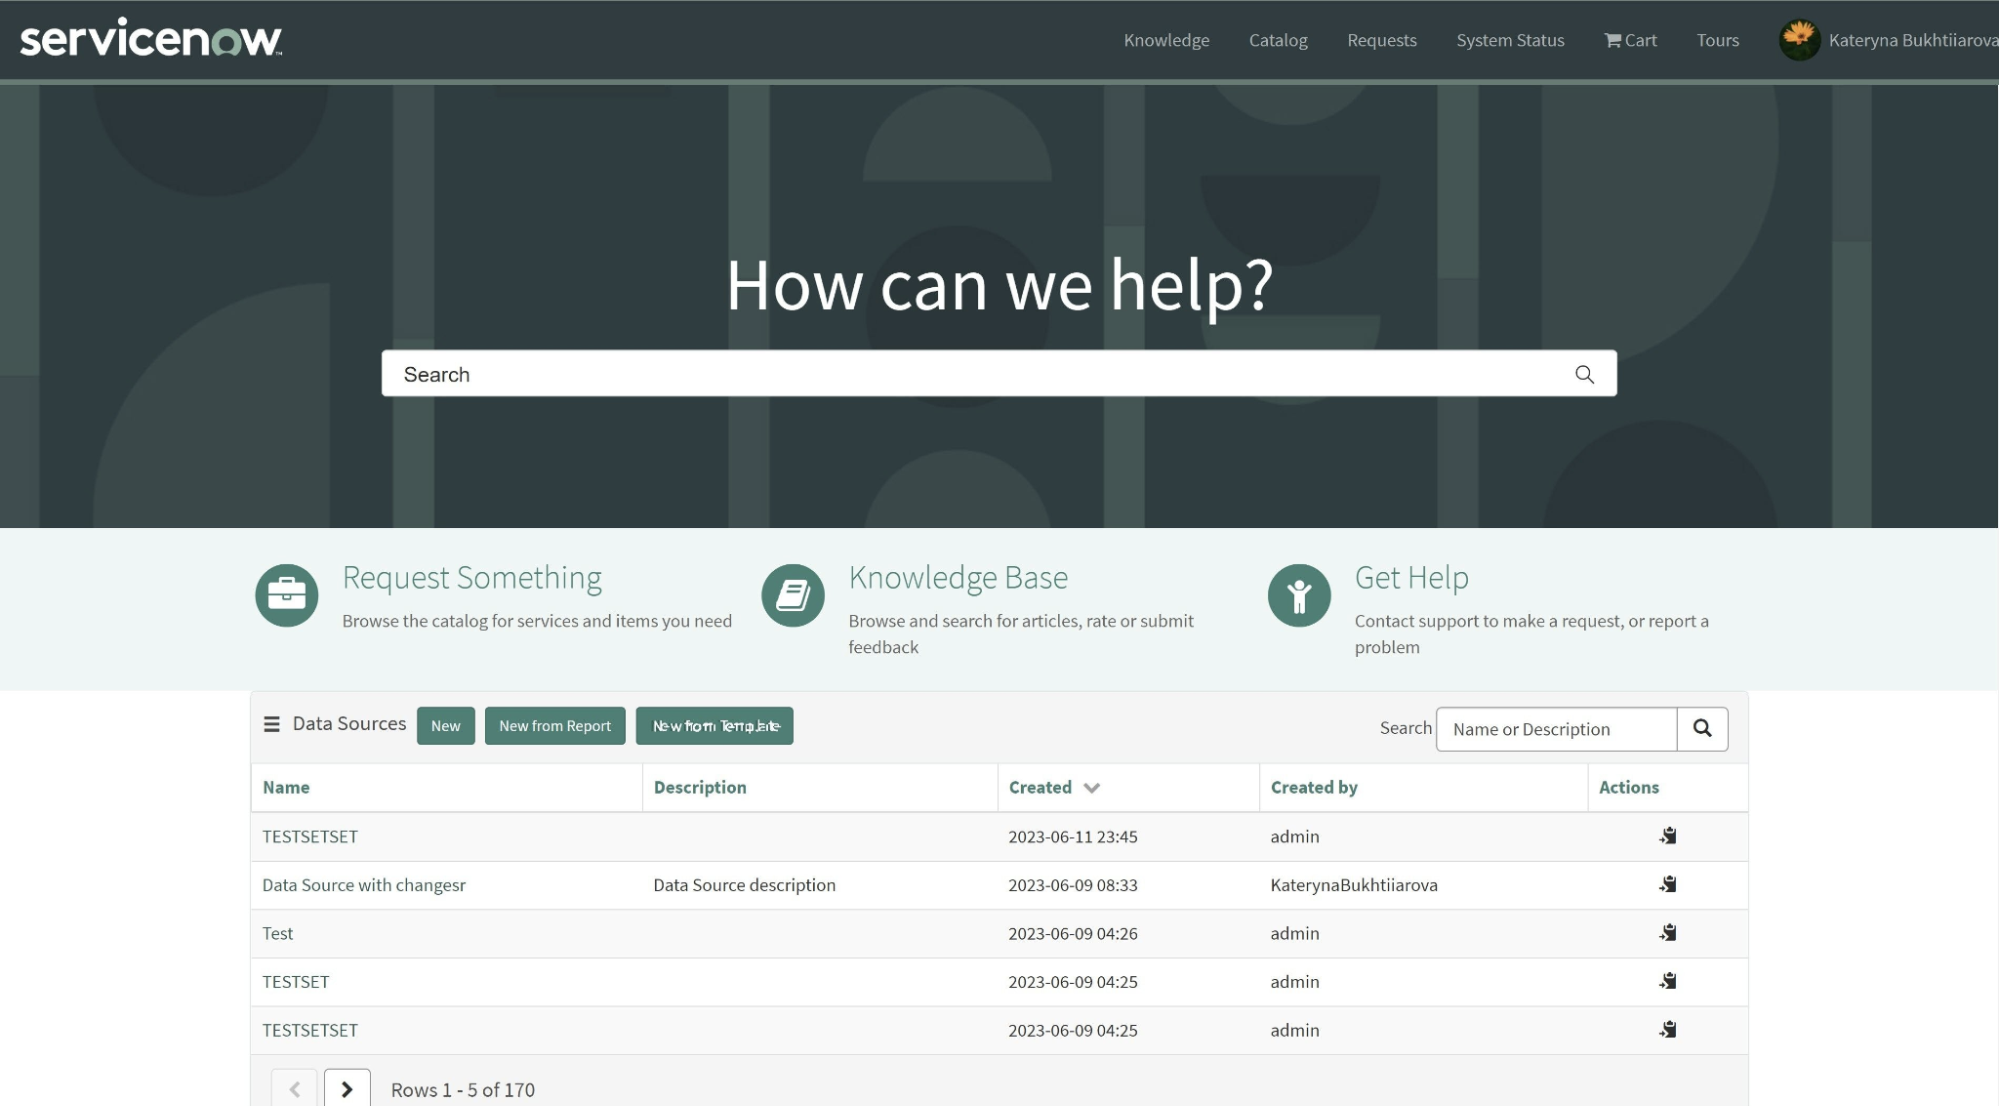
OR
- From the Power BI Connector page (Instance-Name.service-now.com/pbi_connector). Click on the “New” button.
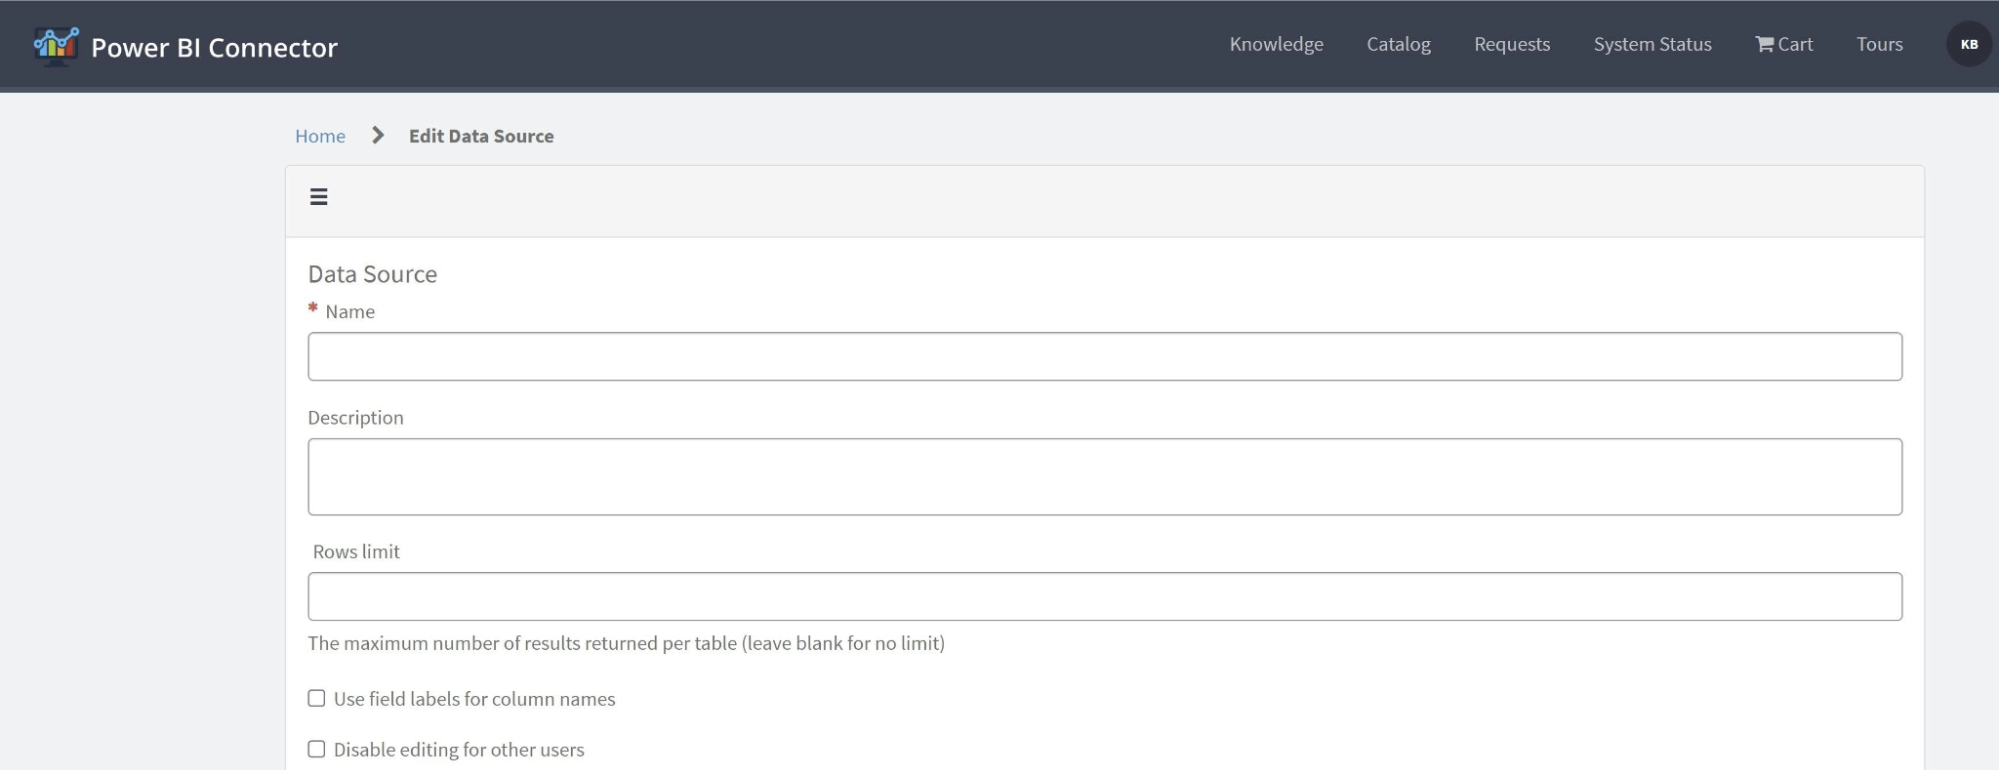
- Fill in the details: name, description, and set the rows limit.
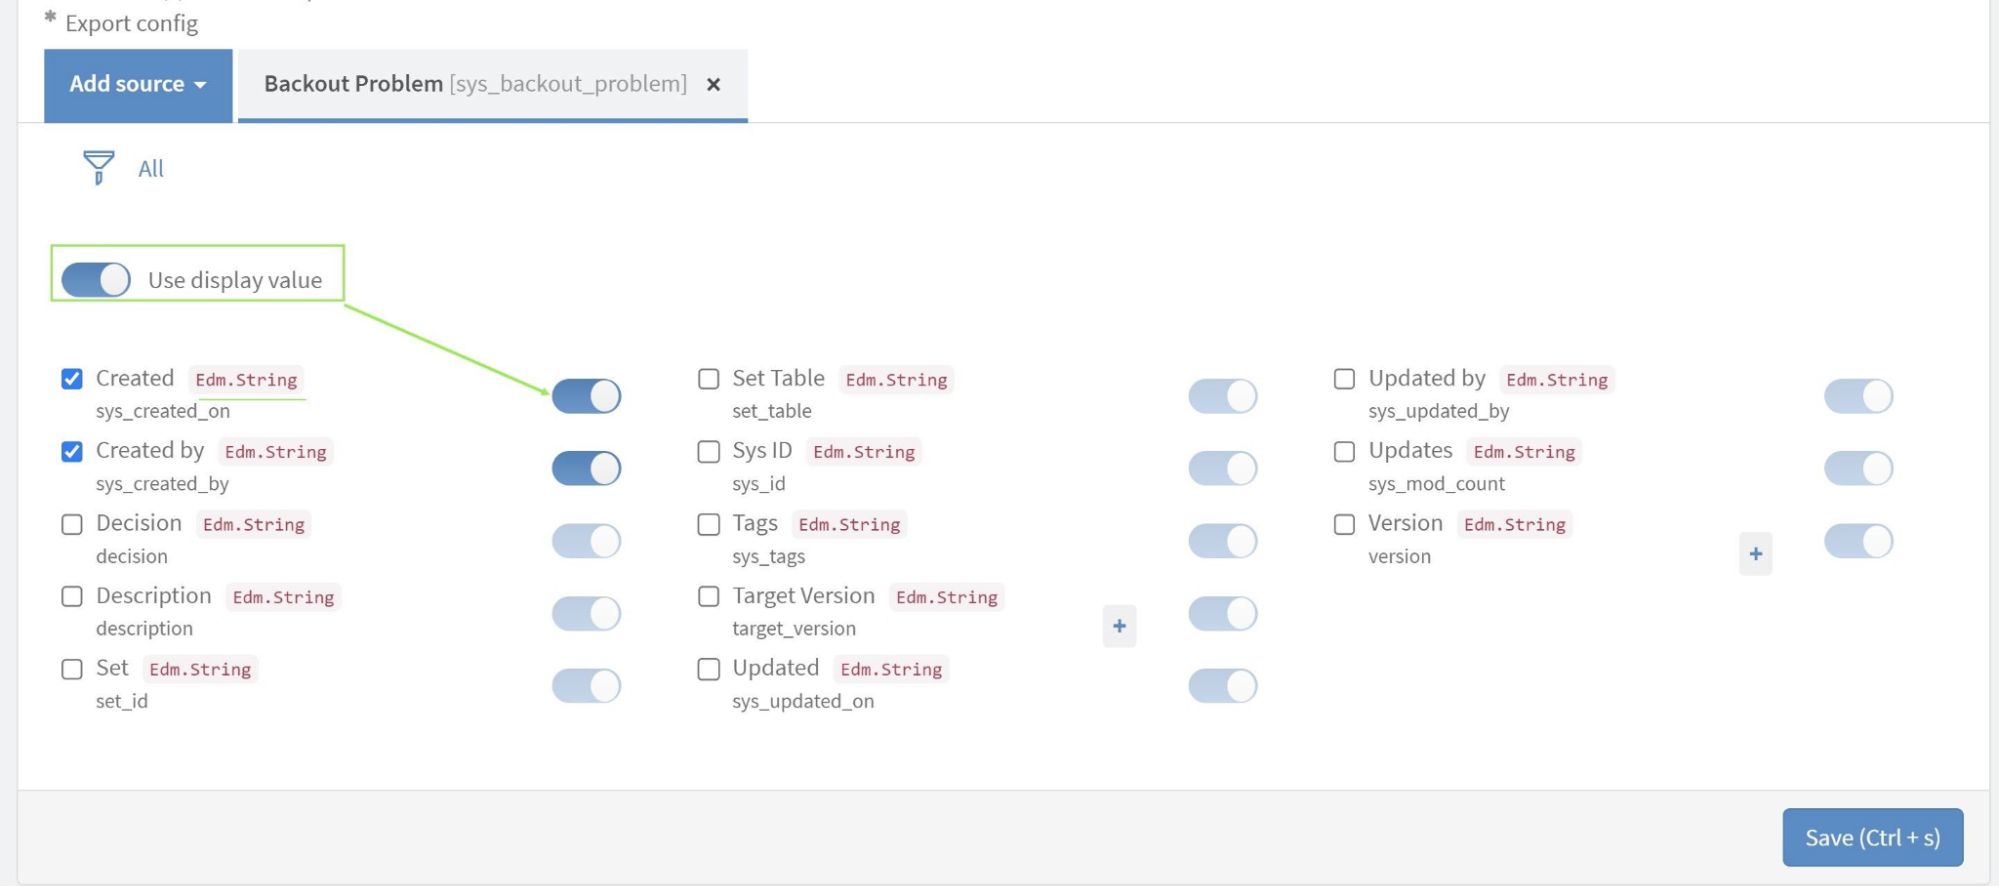
- Choose the fields needed for reports, including custom tables and fields.
- Optionally, enable “Use display value” to export data in string format.
- Apply filters to narrow down export results if necessary.
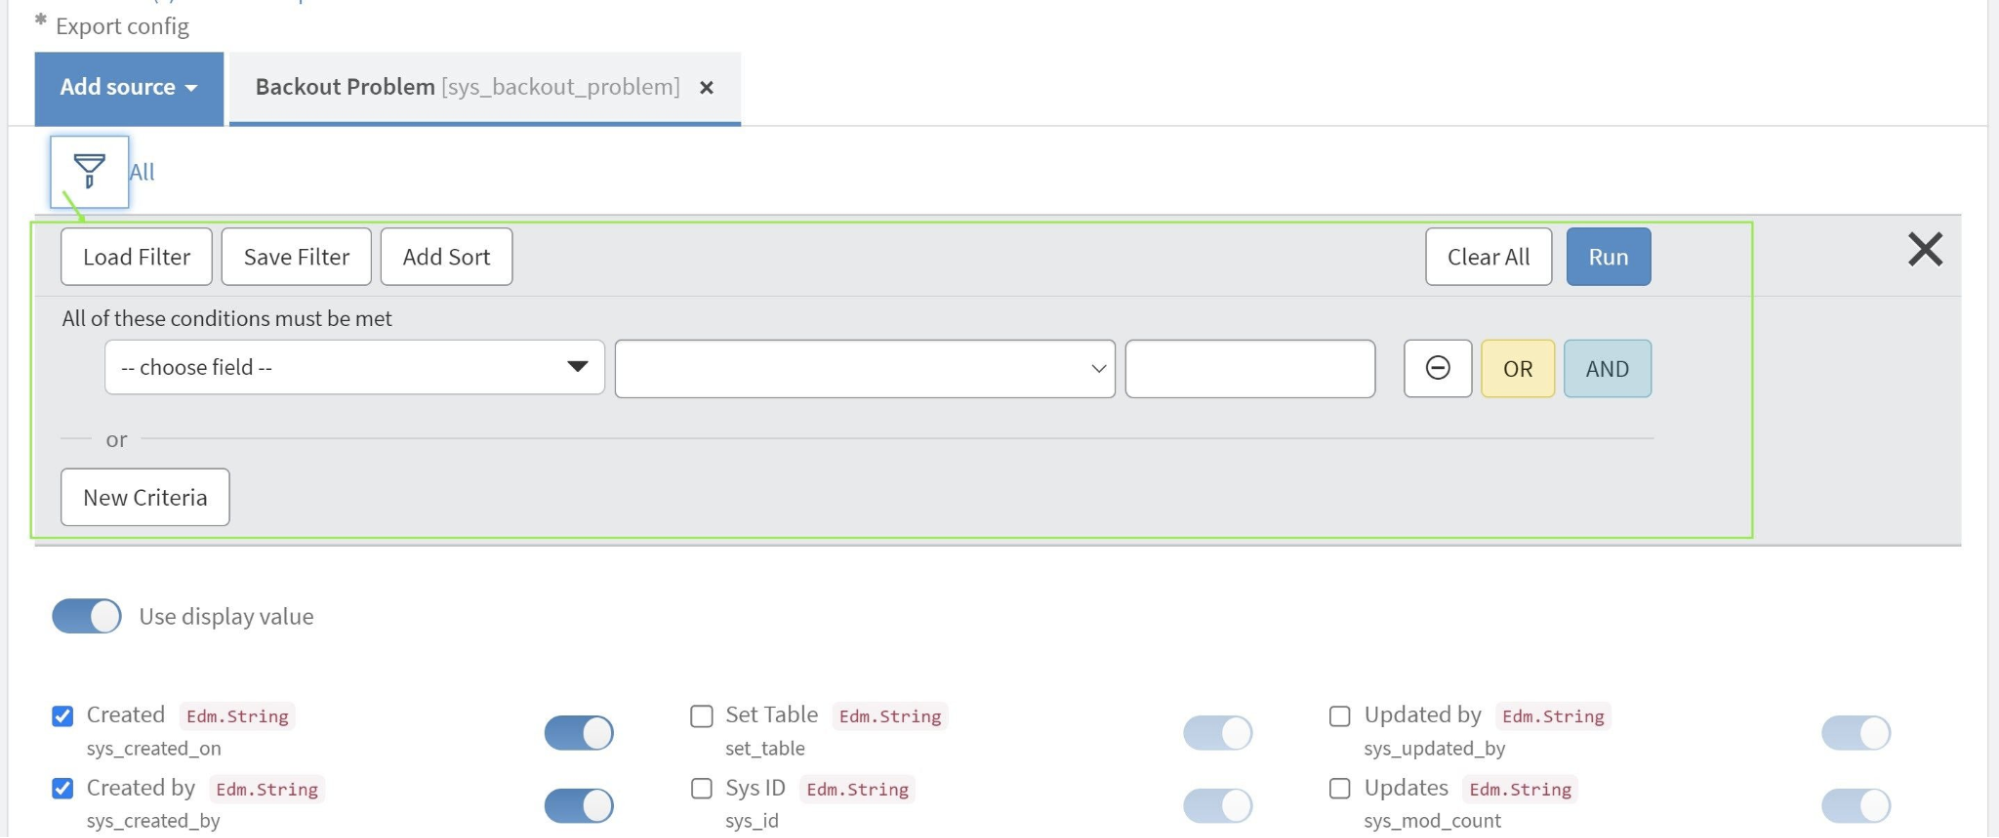
- Save the data source by clicking the “Save” button at the end of the page.
Step 3: Export ServiceNow Data to Power BI
- Visit Instance-Name.service-now.com/pbi_connector.
- Scroll down to the Data Sources table. Use the Search functionality to locate it by Name or Description.
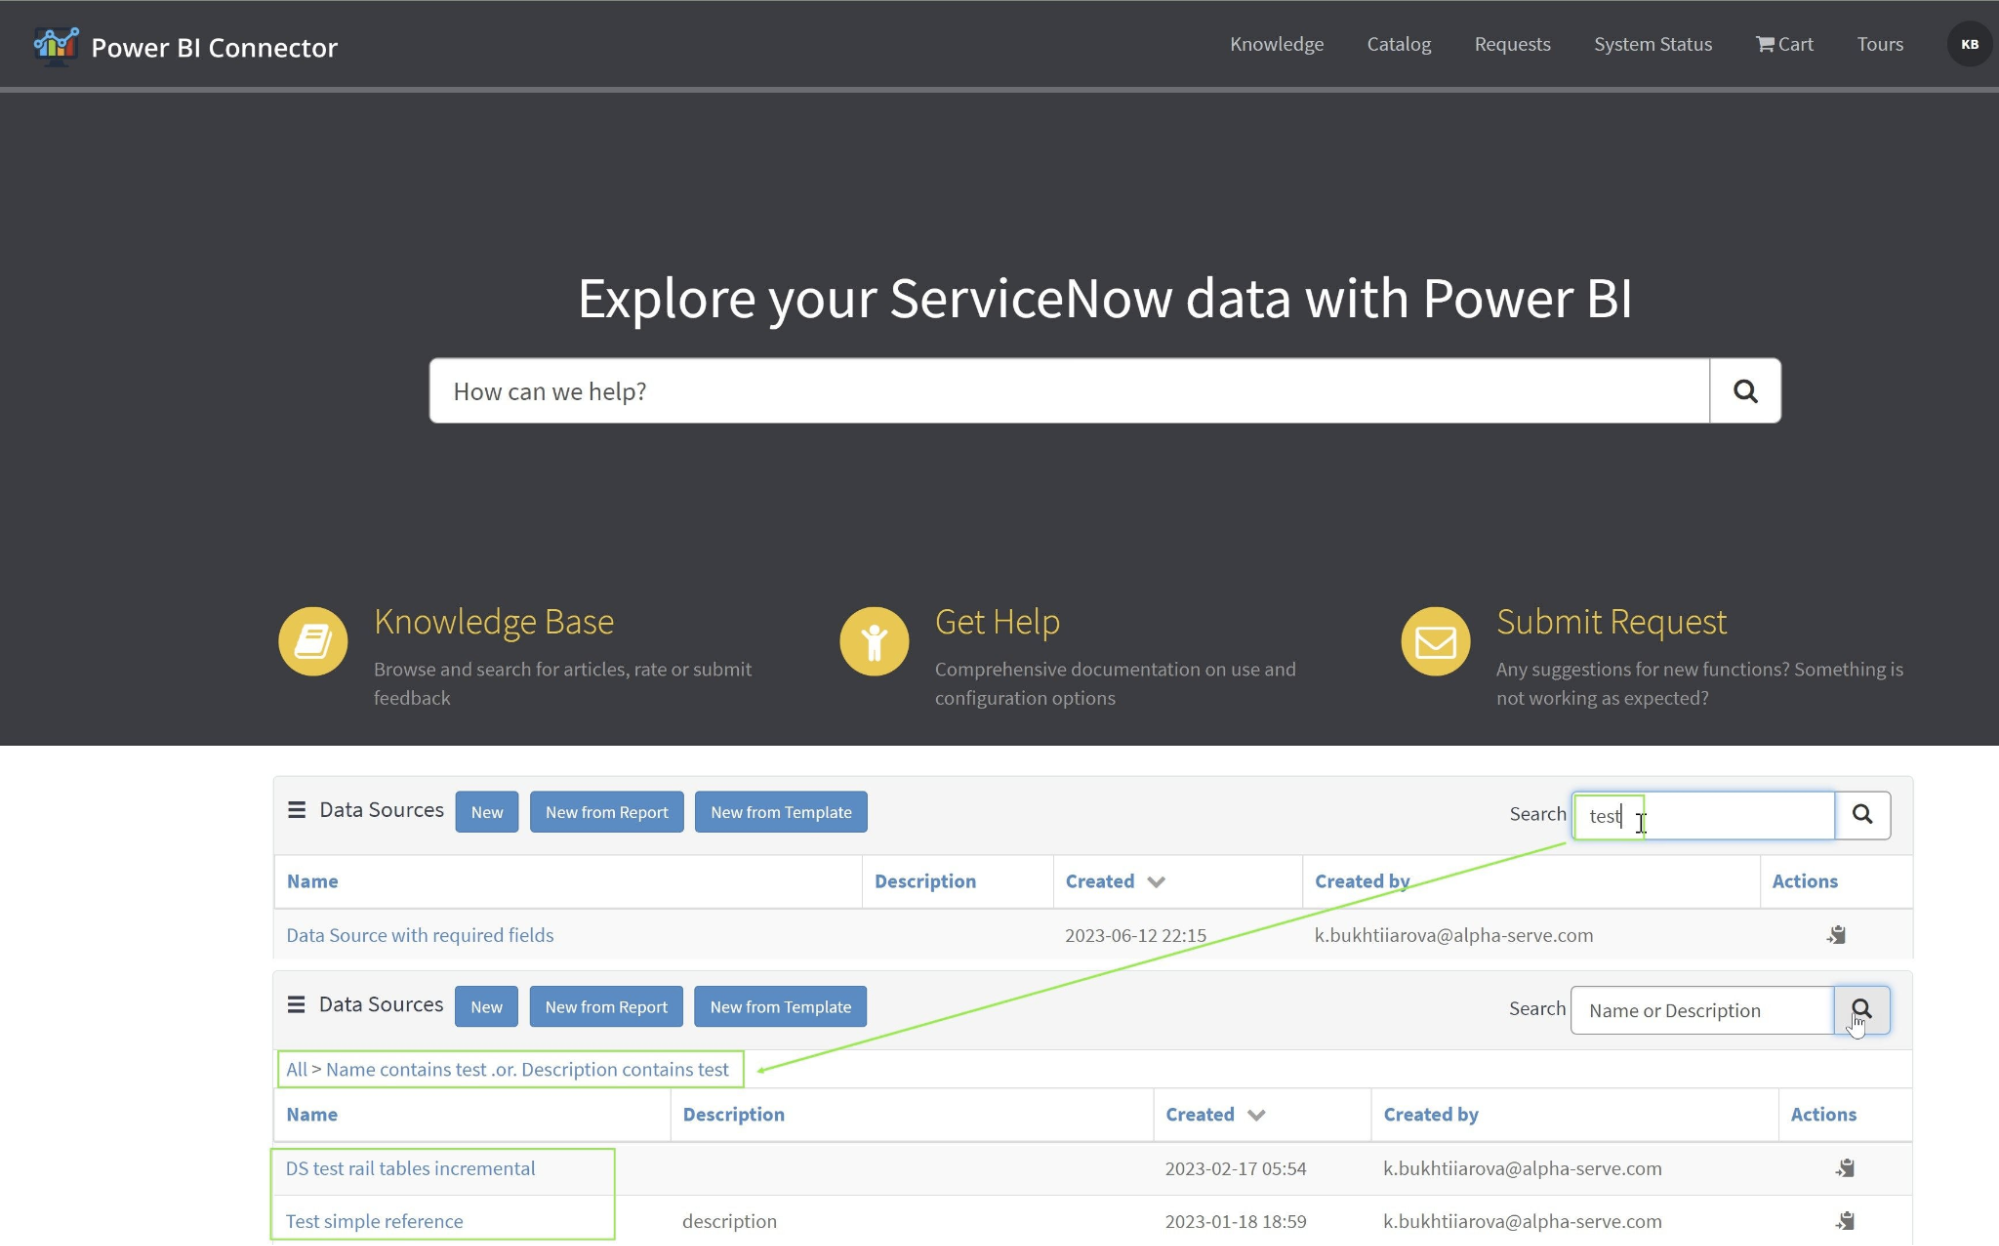
- Choose the desired data source using Show Matching or Filter Out filters.

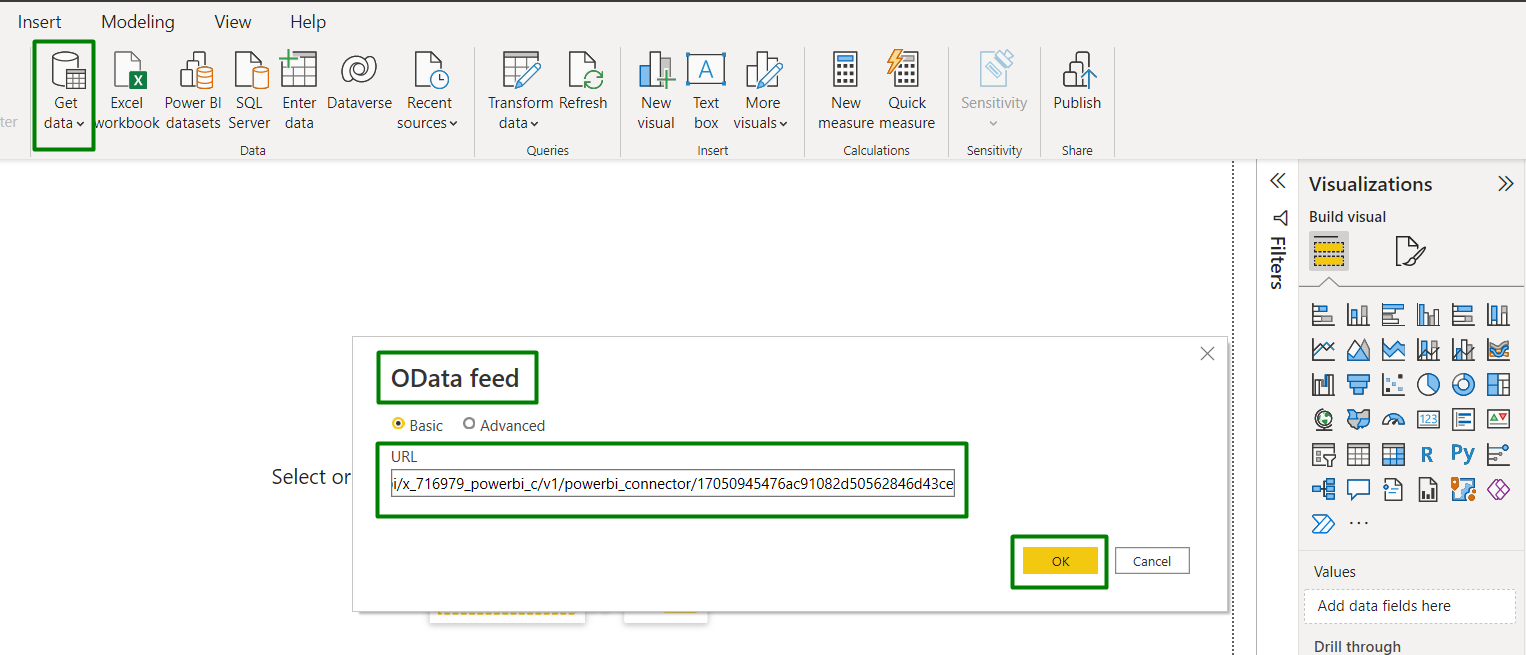
- Right-click on the data source and select Copy OData feed URL. Open Power BI Desktop. Click “Get Data” and choose “OData feed.” Paste the copied URL and click OK.
- In the opened window, switch to Basic authentication. Instead of Basic authentification, you can choose Black Query connection. Enter your ServiceNow credentials and click Connect. In the Navigator preview, select tables to load by checking the checkboxes.
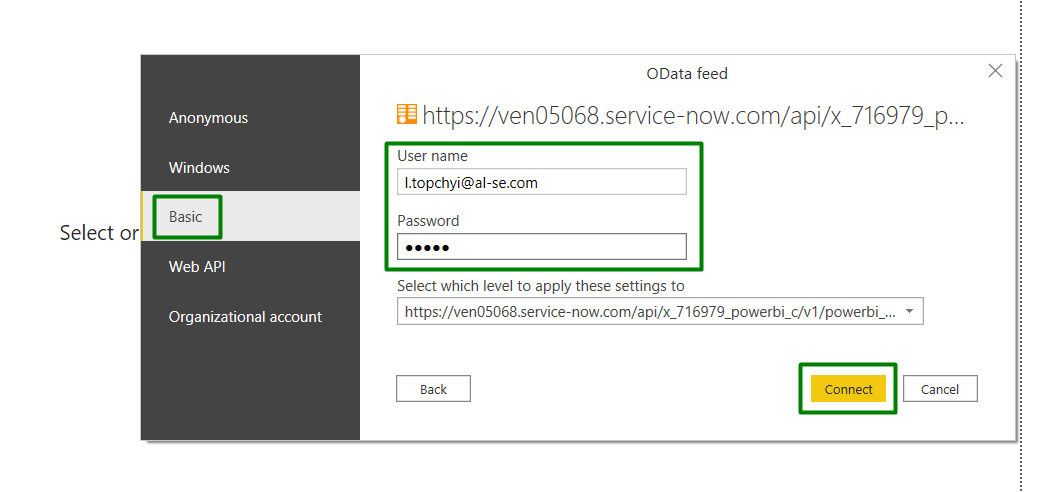
- Click Load to import the selected data into Power BI.
Step 4: Create ServiceNow Reports in Power BI
- After importing data, you can create any ServiceNow reports and dashboards in Power BI.
- Customize your reports as per your analysis requirements, applying filters, measures, and visuals.
- Save and publish your reports to Power BI Service if you want to share them with others.
For more detailed instructions, please refer to our article How to Connect Power BI to ServiceNow.
Tips to Enhance your ServiceNow Reporting with Power BI
Integrating ServiceNow with Power BI offers seamless data consolidation and visualization capabilities. With the Power BI Connector for ServiceNow, you gain access to enhanced functionalities. Explore a range of tips and tricks, encompassing both insights related to the Power BI Connector and general advice, to optimize your ServiceNow reporting strategy effectively.
Implement Cross-Platform Reporting with Power BI
To enhance your reporting capabilities, leverage Power BI’s cross-platform integration, allowing you to seamlessly merge your ServiceNow data with information from various sources. This integration enables comprehensive analysis, enriching your insights and strengthening value-added processes. Incorporating data from diverse sources empowers your organization with deeper intelligence and increased agility. With Power BI’s analytical prowess, you can dissect extensive datasets, providing stakeholders with detailed insights to inform and shape business strategies effectively.
Optimize ServiceNow Reporting with Power BI Dashboard Templates
Unlock the full potential of your ServiceNow data analysis with ready-to-use Power BI Dashboard Templates, a game-changing feature provided directly through the Power BI Connector. These templates offer a revolutionary solution, enabling users to effortlessly create visually stunning Power BI dashboards without the need for extensive technical expertise. With five meticulously crafted templates available, specifically tailored to address common ServiceNow reporting needs, users can quickly gain valuable insights and drive informed decision-making. By leveraging these pre-configured Power BI dashboard templates for ServiceNow, users can save significant time and resources, allowing them to focus on extracting actionable insights and driving business growth.
- ServiceNow Incident Management Dashboard: Visualize real-time incident data and performance metrics to streamline incident resolution processes.
- ServiceNow Problem Management Dashboard: Get insights into current problem statuses and performance trends to enhance problem-solving strategies.
- ServiceNow Problem Request Dashboard: Monitor the flow and efficiency of service requests, identifying areas for process optimization.
- ServiceNow Change Management Dashboard: Oversee change requests, tracking their progression and performance to ensure successful implementation.
- ServiceNow Configuration Items Dashboard: Manage and analyze configuration data supporting informed IT infrastructure decisions.
How to use Power BI templates? Please follow our detailed instructions for seamless integration and optimal use.
Implement Schedule Automated ServiceNow Data Export
Keep your ServiceNow reports in Power BI accurate and current without constant manual checks:
- Embrace Automation: Utilize the scheduled refresh feature in Power BI to automate data updates, ensuring your ServiceNow reports are always current.
- Optimize Refresh Timing: Set refresh schedules at strategic times, like early morning, to ensure data is updated before your workday begins, enhancing productivity and decision-making.
- Use On-Demand Updates: While real-time syncing isn’t available for ServiceNow data in Power BI, on-demand refreshes can provide updates when you need them most.
Scheduled refreshes in Power BI remove the hassle of manual updates and ensure your decision-making is based on the latest data from ServiceNow.
Use Dot-walking for Enhanced ServiceNow Reporting
The dot-walking mechanism is vital for advanced ServiceNow reporting because it enables users to access and report on interconnected data across different tables without requiring complex scripting or database queries. This capability is particularly important in ServiceNow’s relational data model, where tables are often interlinked, and understanding these relationships is critical to extracting meaningful insights. With Power BI Connector users can utilize dot-walking to export and analyze reference-type ServiceNow data effectively. Follow the steps below to find out how to use a dot-walking mechanism to export Reference type data:
- Open Power BI Connector for ServiceNow. Ensure you have the necessary permissions and access rights to use the connector effectively.
- In the connector interface, proceed to the Data Source page. Here, you can create a new data source or modify an existing one to include reference-type data using dot-walking.
- Identify the table that contains Reference type fields. These fields will be indicated with a “+” sign.
- Click the “+” sign next to the field you wish to expand. This action will open a dialog showing the hierarchy of the parent and child fields.
- Within the dialog, choose the necessary fields by clicking on them. If you need to access nested data, use the “+” icon to delve further into related child fields.
- Once you have selected all the relevant fields, confirm your selections and save the data source configuration.
- Export the OData URL from the connector and integrate it into Power BI Desktop for advanced data analysis and reporting.
For more detailed instructions on how to use dot-walking in Power BI Connector for ServiceNow check out app documentation.
Ensure ServiceNow Data Security
To safeguard the integrity and confidentiality of your ServiceNow data, assigning appropriate roles and permissions in Power BI Connector is crucial. Regularly audit and adjust the following roles to align with security standards and user responsibilities, maintaining secure and compliant reporting.
Assign specific roles to ensure data security:
- PBI ADMIN (x_acsof_power_bi_s.powerbi_admin): Grant this role to users who need comprehensive control over data sources, including the ability to read, write, create, and delete. Ensure they have access to the PBI Connector for ServiceNow and can export the necessary tables, with read access to the sys_db_object table to view ServiceNow table lists.
- PBI EDITOR (x_acsof_power_bi_s.powerbi_editor): Users with this role should be able to read, write, and create data sources. Like admins, they need access to the PBI Connector and the ability to export ServiceNow tables they have rights to, plus read access to the sys_db_object table.
- PBI VIEWER (x_acsof_power_bi_s.powerbi_viewer): Assign this role to users who only need to read data sources. They should have access to the PBI Connector for ServiceNow and the capability to export tables they are permitted to view.
To address all your queries regarding the security of the ServiceNow Power BI Connector, please refer to our article “Power BI Connector for ServiceNow: Is My Data Secure?” for detailed information and guidance.
Recap
Selecting Microsoft Power BI for advanced ServiceNow reporting provides users with unparalleled data processing power and advanced analytics, allowing for the extraction of subtle insights from complex data sets. The ServiceNowPower BI integration enhances data visualization and interactivity, offering a more dynamic and user-friendly reporting environment than native ServiceNow plugins. Furthermore, Power BI’s ability to integrate with a wide array of data sources extends the scope of ServiceNow reporting, ensuring comprehensive business intelligence that supports evidence-based strategizing.
About acSoft Blog
The acSoft blog is your trusted source for all things ServiceNow. As a reputable ServiceNow Build Partner with Now Certified apps on the ServiceNow Store, acSoft Inc. offers unparalleled expertise in the ServiceNow ecosystem. Focused solely on ServiceNow topics, our blog provides comprehensive coverage of ServiceNow products, solutions, tips, tricks, and how-to guides. With content curated by industry experts deeply immersed in the ServiceNow community, you can rely on the acSoft blog for clear, reliable, and up-to-date insights to enhance your ServiceNow experience.