ServiceNow Database View is one of the key features of ServiceNow — a powerful platform that helps organizations streamline their workflows and enhance efficiency. If you wish to create custom views of data within the platform, this tool is made for you. This article will guide you through setting up a Database View in ServiceNow and effective reporting with Tableau and Power BI.
- ServiceNow Database View in Details
- How Database View in ServiceNow Works
- Importance of Database ServiceNow View
- How to Create a Database View in ServiceNow
- Reporting Tips for ServiceNow Database View
- Recap
ServiceNow Database View in Details
The ServiceNow Database View, an integral feature within the ServiceNow platform, is crafted to elevate users’ data organization and retrieval capabilities. This dynamic tool empowers organizations to fashion personalized data views sourced from one or more tables within the ServiceNow database, each corresponding to a specific aspect of the platform, such as incidents, problems, or changes.
At its core, a Database View can be seen as a virtual table that symbolizes a connection between multiple contributing tables. Within this construct, the rows are formed by combinations of source records from these contributing tables, aligning based on predetermined mappings that dictate shared values. In essence, it serves as a consolidated representation, amalgamating data from various sources through specified correlations.
How Database View in ServiceNow Works
Database View enables users to tailor their data displays, apply filters based on specific criteria, and extract valuable insights through streamlined reporting processes. Users can craft bespoke views by formulating queries, utilizing a query builder that facilitates defining conditions and filters, and restricting the data retrieved from one or more tables. These queries can be saved as custom views, fostering reusability and sharing among users.
Additionally, the Database View incorporates a robust data manipulation tool, offering users the ability to modify data within their ServiceNow databases seamlessly. The user-friendly interface allows for tasks like adding, deleting, or modifying data in tables. Furthermore, the Database View boasts a data import tool, enabling users to import data from external sources into their ServiceNow databases effortlessly.
Importance of Database ServiceNow View
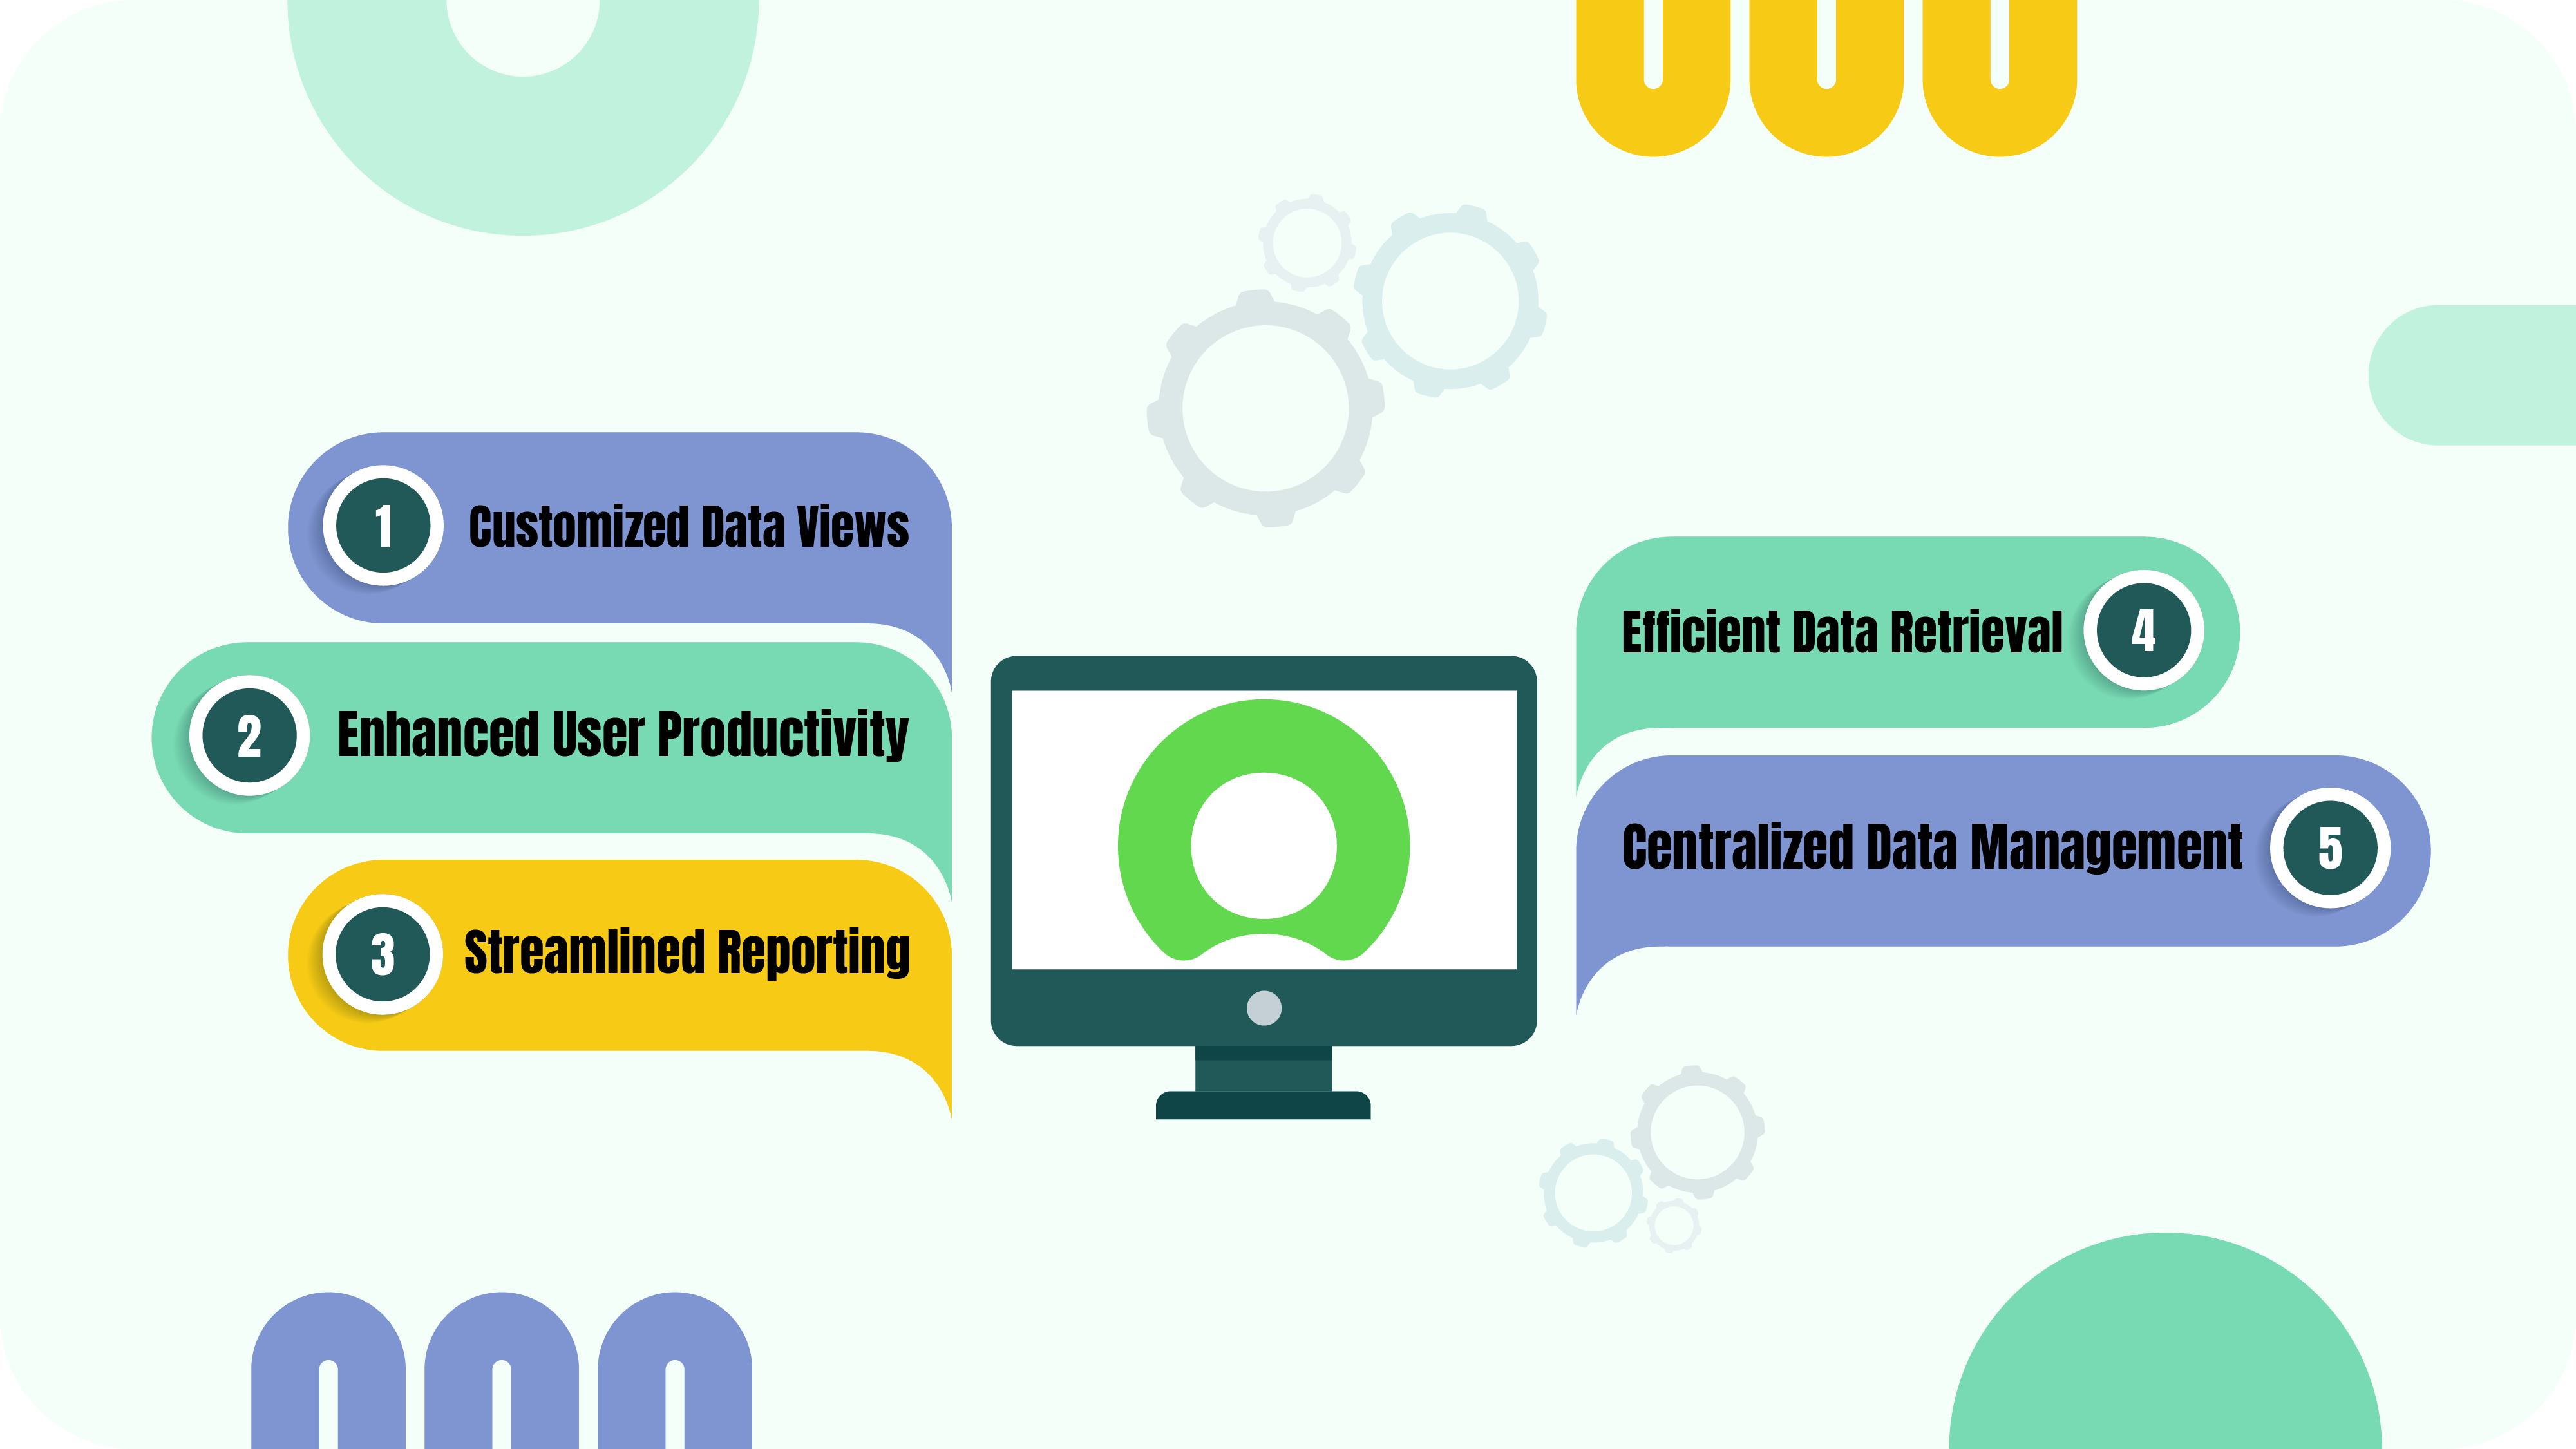
You might wonder what implementing ServiceNow Database Views offers. Well, several benefits contribute to improved data management, reporting capabilities, and overall efficiency within the platform. Let’s delve into more details for each of the five main pros of using ServiceNow Database Views.
1. Customized Data Views
Basically, Database Views empower users to create customized views of data tailored to their specific tasks or processes. For instance, consider a scenario where a ServiceNow user is responsible for tracking and resolving incidents. With Database Views, they can create a personalized view that displays only the relevant fields, such as incident status, priority, and assignee, making it easier to focus on critical information without unnecessary clutter.
2. Efficient Data Retrieval
Users can retrieve data more efficiently by defining queries within Database Views. This eliminates the need to navigate through extensive datasets, ensuring quick access to pertinent information. For example, a ServiceNow administrator might use a Database View to retrieve a list of high-priority incidents reported in the last 24 hours. By specifying the criteria in the query, they can quickly obtain the relevant data without manually sifting through large datasets.
3. Streamlined Reporting
The ability to create custom views aids in generating focused and meaningful reports. Users can structure data displays to suit their analytical needs, leading to more insightful and actionable results. As an illustration, consider a ServiceNow manager responsible for monitoring change requests. Using Database Views, they can create a custom view that highlights key metrics such as the number of open changes, their status, and the average time to resolution.
4. Enhanced User Productivity
With a user-friendly interface and the ability to organize data based on individual preferences, Database Views contribute to increased task efficiency. For instance, a ServiceNow support agent can configure a Database View to display essential information about open incidents, including customer details, issue description, and resolution status. This tailored view enables the agent to efficiently manage and prioritize their tasks, enhancing overall productivity.
5. Centralized Data Management
Database Views facilitate the consolidation of data from multiple tables, providing a centralized and organized view. This simplifies data management, making it easier for users to work with interconnected information. In a practical scenario, a ServiceNow administrator dealing with asset management can create a Database View that consolidates data from tables containing information about hardware, software, and user assignments. This centralized view streamlines the management of diverse data sources, ensuring a cohesive and organized perspective.
How to Create a Database View in ServiceNow

To create a Database View in ServiceNow you should follow a straightforward procedure. Begin by navigating to the “All > System Definition > Database Views” section and selecting “New“. Assign a name to the view, keeping in mind that the application converts capital letters to lowercase and spaces to underscores. Additionally, provide a Label and a Plural name, as these fields determine how the database view is presented in lists and forms. Optionally, include a description to convey the view’s purpose to other users. Once the details are filled in, submit the form, resulting in the creation of the database view, which becomes accessible from the Database Views module.
To enhance the view, tables can be added by selecting “New” in the View Tables related list. Configure the form, add the Left join field, and save the changes. Enabling the Left join option allows the left-hand table to display all records, irrespective of matching conditions on the right-hand table. This is particularly useful for viewing tables with specified Where clauses. The order of joined tables is determined by their Order values, with the leftmost table having the lowest Order value. After completing the form and submitting it, personalize the View Tables related list to display the Left join column, which should now be marked as true.
To ensure the functionality of the created view, navigate back to “All > System Definition > Database Views,” select the desired view, and test it by clicking the “Try It” related link. This step allows for a verification process, ensuring that the database view operates as intended. This concise set of actions guides users through the process of creating, configuring, and testing a Database View in ServiceNow.
Reporting Tips for ServiceNow Database View

In a typical report, you can only select data from one table. However, when you create a database view in ServiceNow, you can combine the contents from two or more tables into a single “table.” Then, you can easily create reports from there.
Here is one database view ServiceNow example. Let’s say you want to filter active incidents in the In Progress state and have a duration of more than three days. You can customize the fields displayed on the report by accessing the table context menu from the report and then selecting Database View. Click on the Try It related link from the database view to open the table with joined tables and edit the list layout.
By creating a database view and using it as the report’s data source, you can generate a report that displays incident records that are in the In Progress state for more than three days with fields such as Number, Short Description, State, Priority, Duration, and more, as per your requirement.
In specific scenarios, the native reporting functionality within ServiceNow may fall short of meeting particular analytical needs. Whether there’s a requirement to consolidate multiple data sources or conduct in-depth analysis, leveraging business intelligence tools becomes imperative. Previously, Database Views in ServiceNow posed a limitation, as they couldn’t be directly used for data export to Power BI or Tableau. As views of fields from multiple tables were created for reporting purposes, Database Views were not stored, making their export unfeasible.
acSoft Inc., a certified ServiceNow Build Partner, has addressed this challenge with updated versions of their BI connectors. The Power BI Connector for ServiceNow (version 1.5.5) and Tableau Connector for ServiceNow (version 1.0.6) now empower ServiceNow Admin users to create a data source using fields from Database Views. Furthermore, the recent improvements to these apps ensure enhanced accuracy. Database View data export automation mitigates discrepancies or errors in exported data.
This functionality significantly enhances the efficiency of gathering and analyzing data, contributing to improved decision-making. Coupled with the advanced reporting capabilities of these business intelligence tools, users can interact with, visualize, and explore essential data in sophisticated ways, gain comprehensive insights, uncover correlations, identify trends, and reveal hidden relationships.
Explore ServiceNow Database View in Power BI Connector
Microsoft Power BI is an ideal choice for enterprises of all sizes seeking advanced reporting and analytical capabilities beyond Excel. With a focus on easy data visualization and analysis across the entire business, Power BI provides deep insights into operational performance. Notable benefits include access to artificial intelligence (AI) features such as image recognition and text analytics, the ability to analyze and share big data efficiently, personalized dashboards with interactive reports, real-time data updates, seamless integration with Excel, support for a wide range of data sources, and a user-friendly interactive UI/UX with features like easy drag-and-drop functionality and formatting replication across visualizations.
Those powerful reporting functions that can be seamlessly combined with ServiceNow Database Views. To export a Database View to Power BI, first, ensure that you have installed the Power BI Connector for ServiceNow version 1.5.5. If not, follow the installation guide instructions to install the connector. Once installed, follow these steps:
- Navigate to the Power BI Connector page: Instance-Name.service-now.com/pbi_connector.
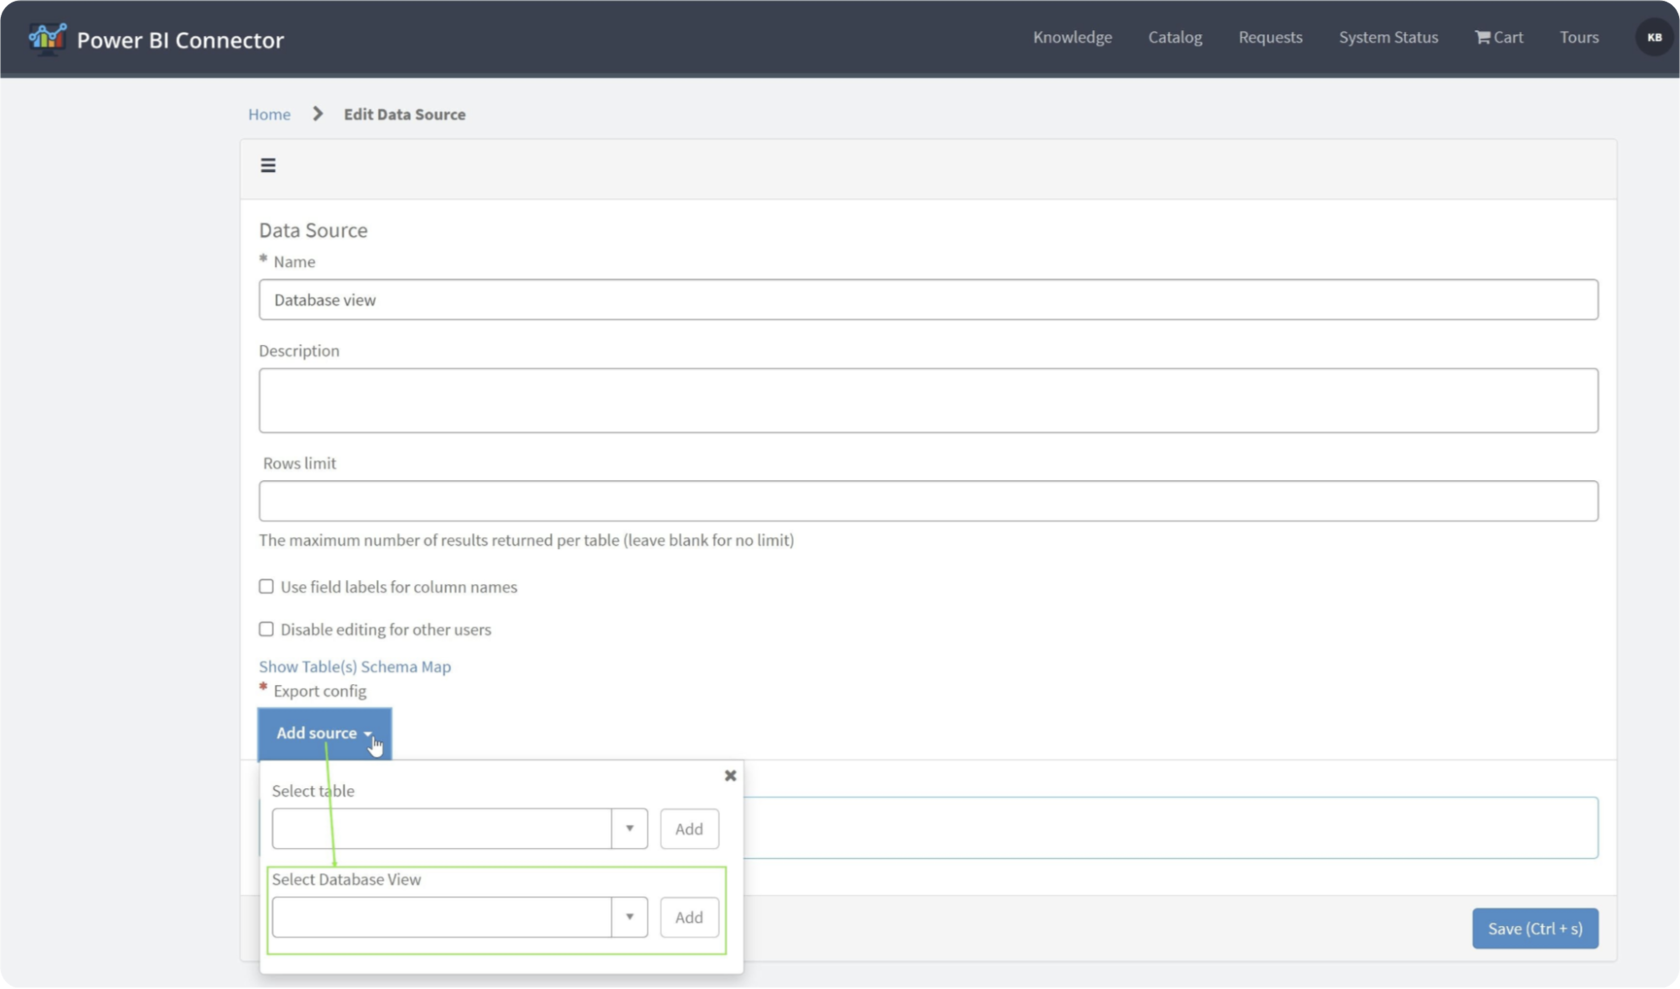
- Fill in required data to create a Data Source.
- Set the Rows limit and choose whether to use field labels for column names.
- Optionally, restrict editing access by checking “Disable editing for other users.”
- Add the Database View tables by clicking the “Add Source” button to
- Select the fields you want to export, adjust options like “Use display value,” and set a Filter string for accurate data, and click “Save.”
- Return to the Power BI Connector page: Instance-Name.service-now.com/pbi_connector and find the Data Source in the list. Right-click it and opt for “Copy OData feed URL.”
- Open Power BI Desktop, click “Get Data,” select “OData feed,” and paste the copied URL.
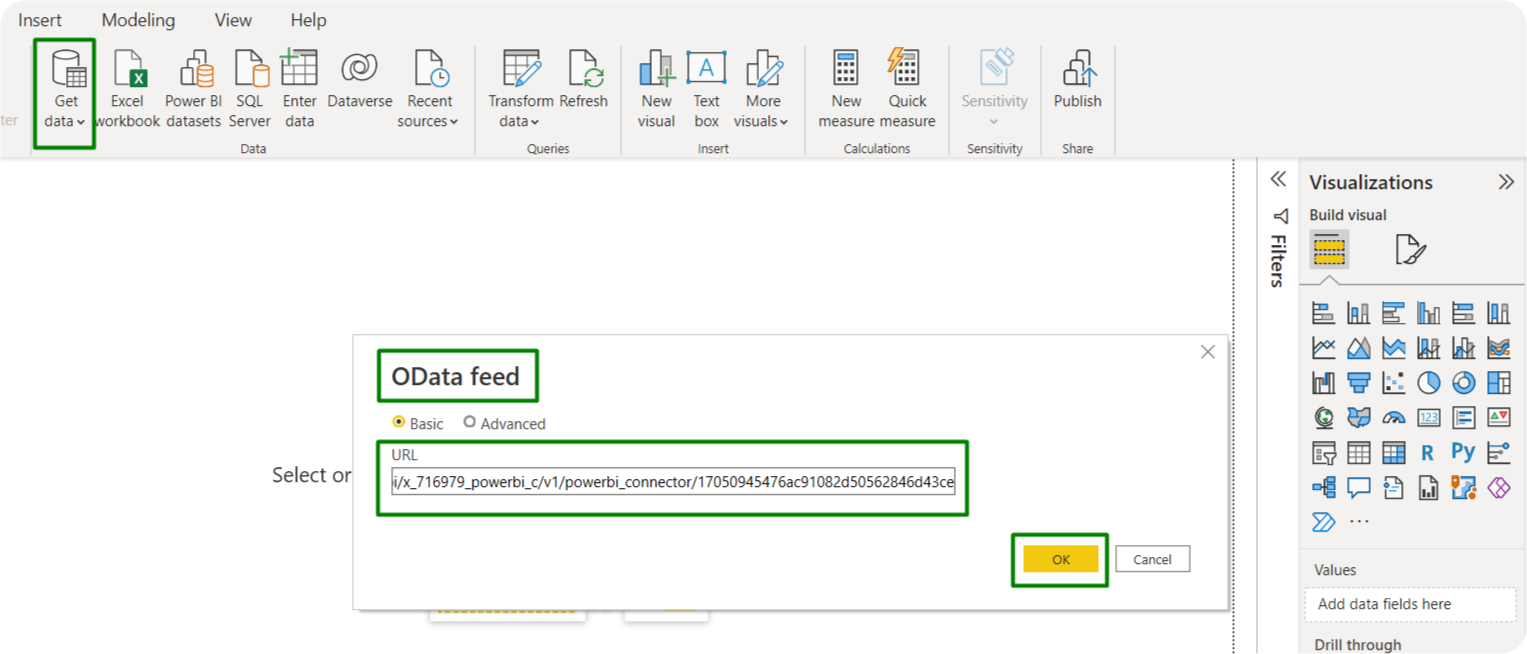
- Configure Basic authentication using your ServiceNow credentials and click “Connect” to establish the connection.
- In the Navigator preview, select the tables to load by checking the checkboxes. Click “Load” to import the data.
Once the import is complete, you can start working with the imported ServiceNow Database View data using Power BI’s features.
Explore ServiceNow Database View in Tableau Connector
Tableau, in turn, stands out as a leading tool for business intelligence, offering unparalleled benefits. With powerful support for intricate calculations, data blending, and dashboarding, Tableau enables the creation of stunning visualizations that provide insights beyond traditional spreadsheet analysis. Its responsive dashboard design caters to various devices, ensuring the optimal presentation of reports on laptops or mobile phones. Tableau’s efficiency in handling large datasets, support for live connections to multiple sources, and user-friendly implementation set it apart. Moreover, incorporating Python or R allows for addressing performance challenges and conducting complex table calculations.
Now imaging binding ServiceNow Database Views with Tableau. To export a Database View to Tableau, ensure you have the Tableau Connector for ServiceNow version 1.0.6 or follow our installation guide to try it. Follow these steps:
- Visit the Tableau Connector page at Instance-Name.service-now.com/tableau_connector.
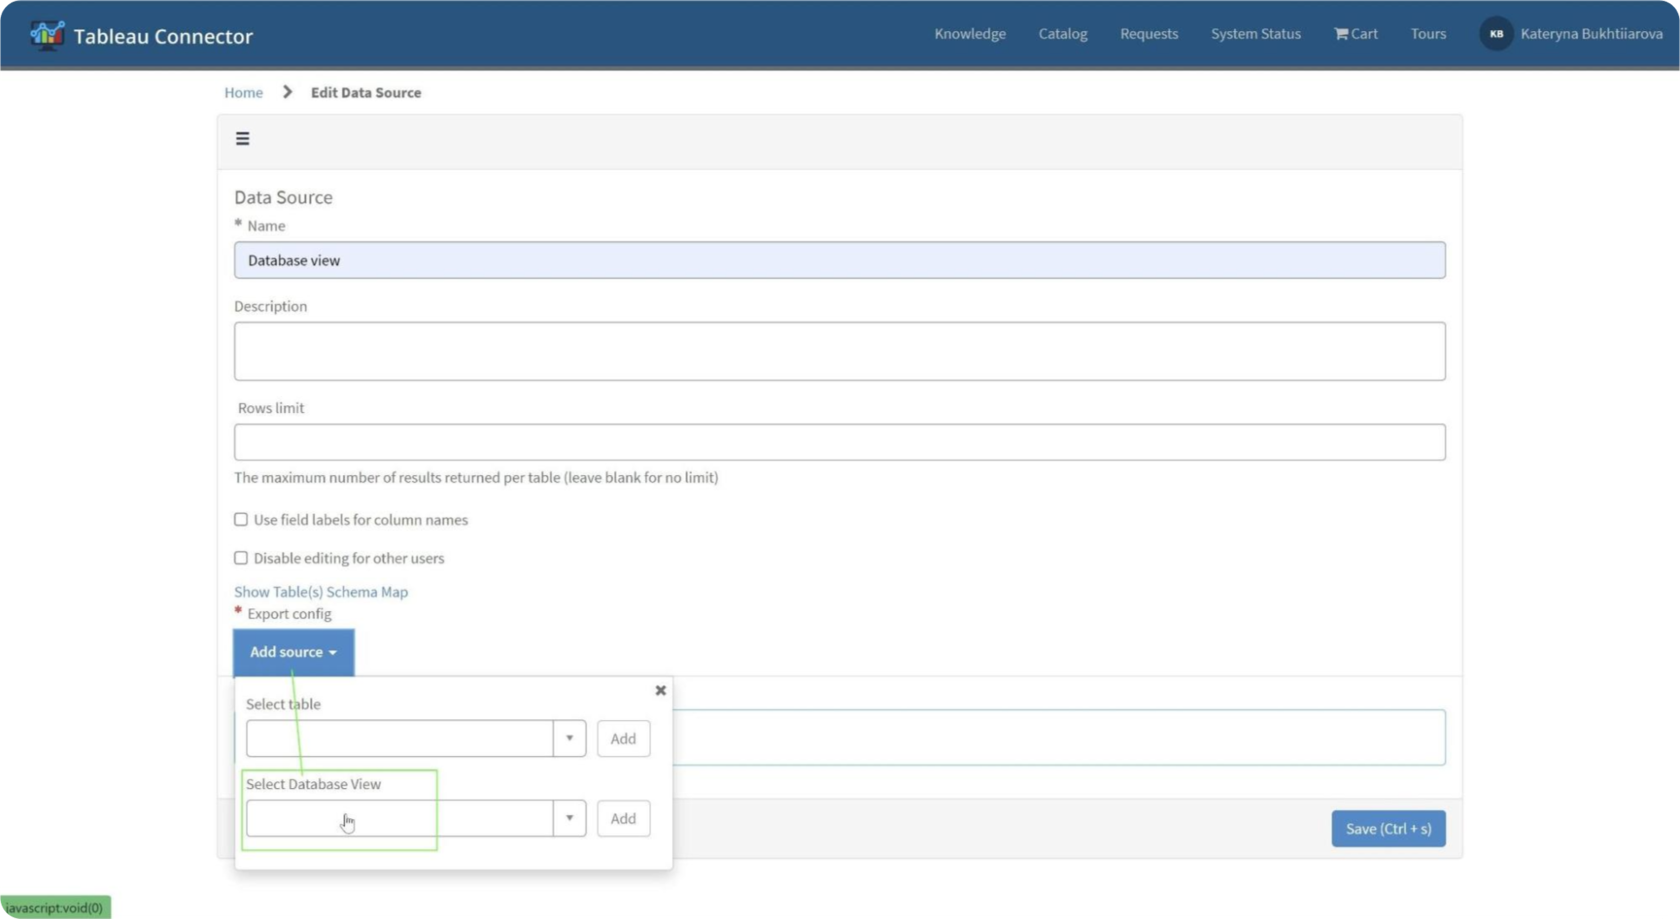
- Click “New” to create a Data Source, providing required information.
- Set Rows limit, choose field label preferences, and add the Database View from the list using “Add Source.”
- Select fields, and configure options like “Use display value” and “Filter string” for accuracy.
- Click “Save” to save the Data Source.
- Locate the Data Source in the list, apply filters or search if needed.
- Right-click on the Data Source and select “Copy OData feed URL.”
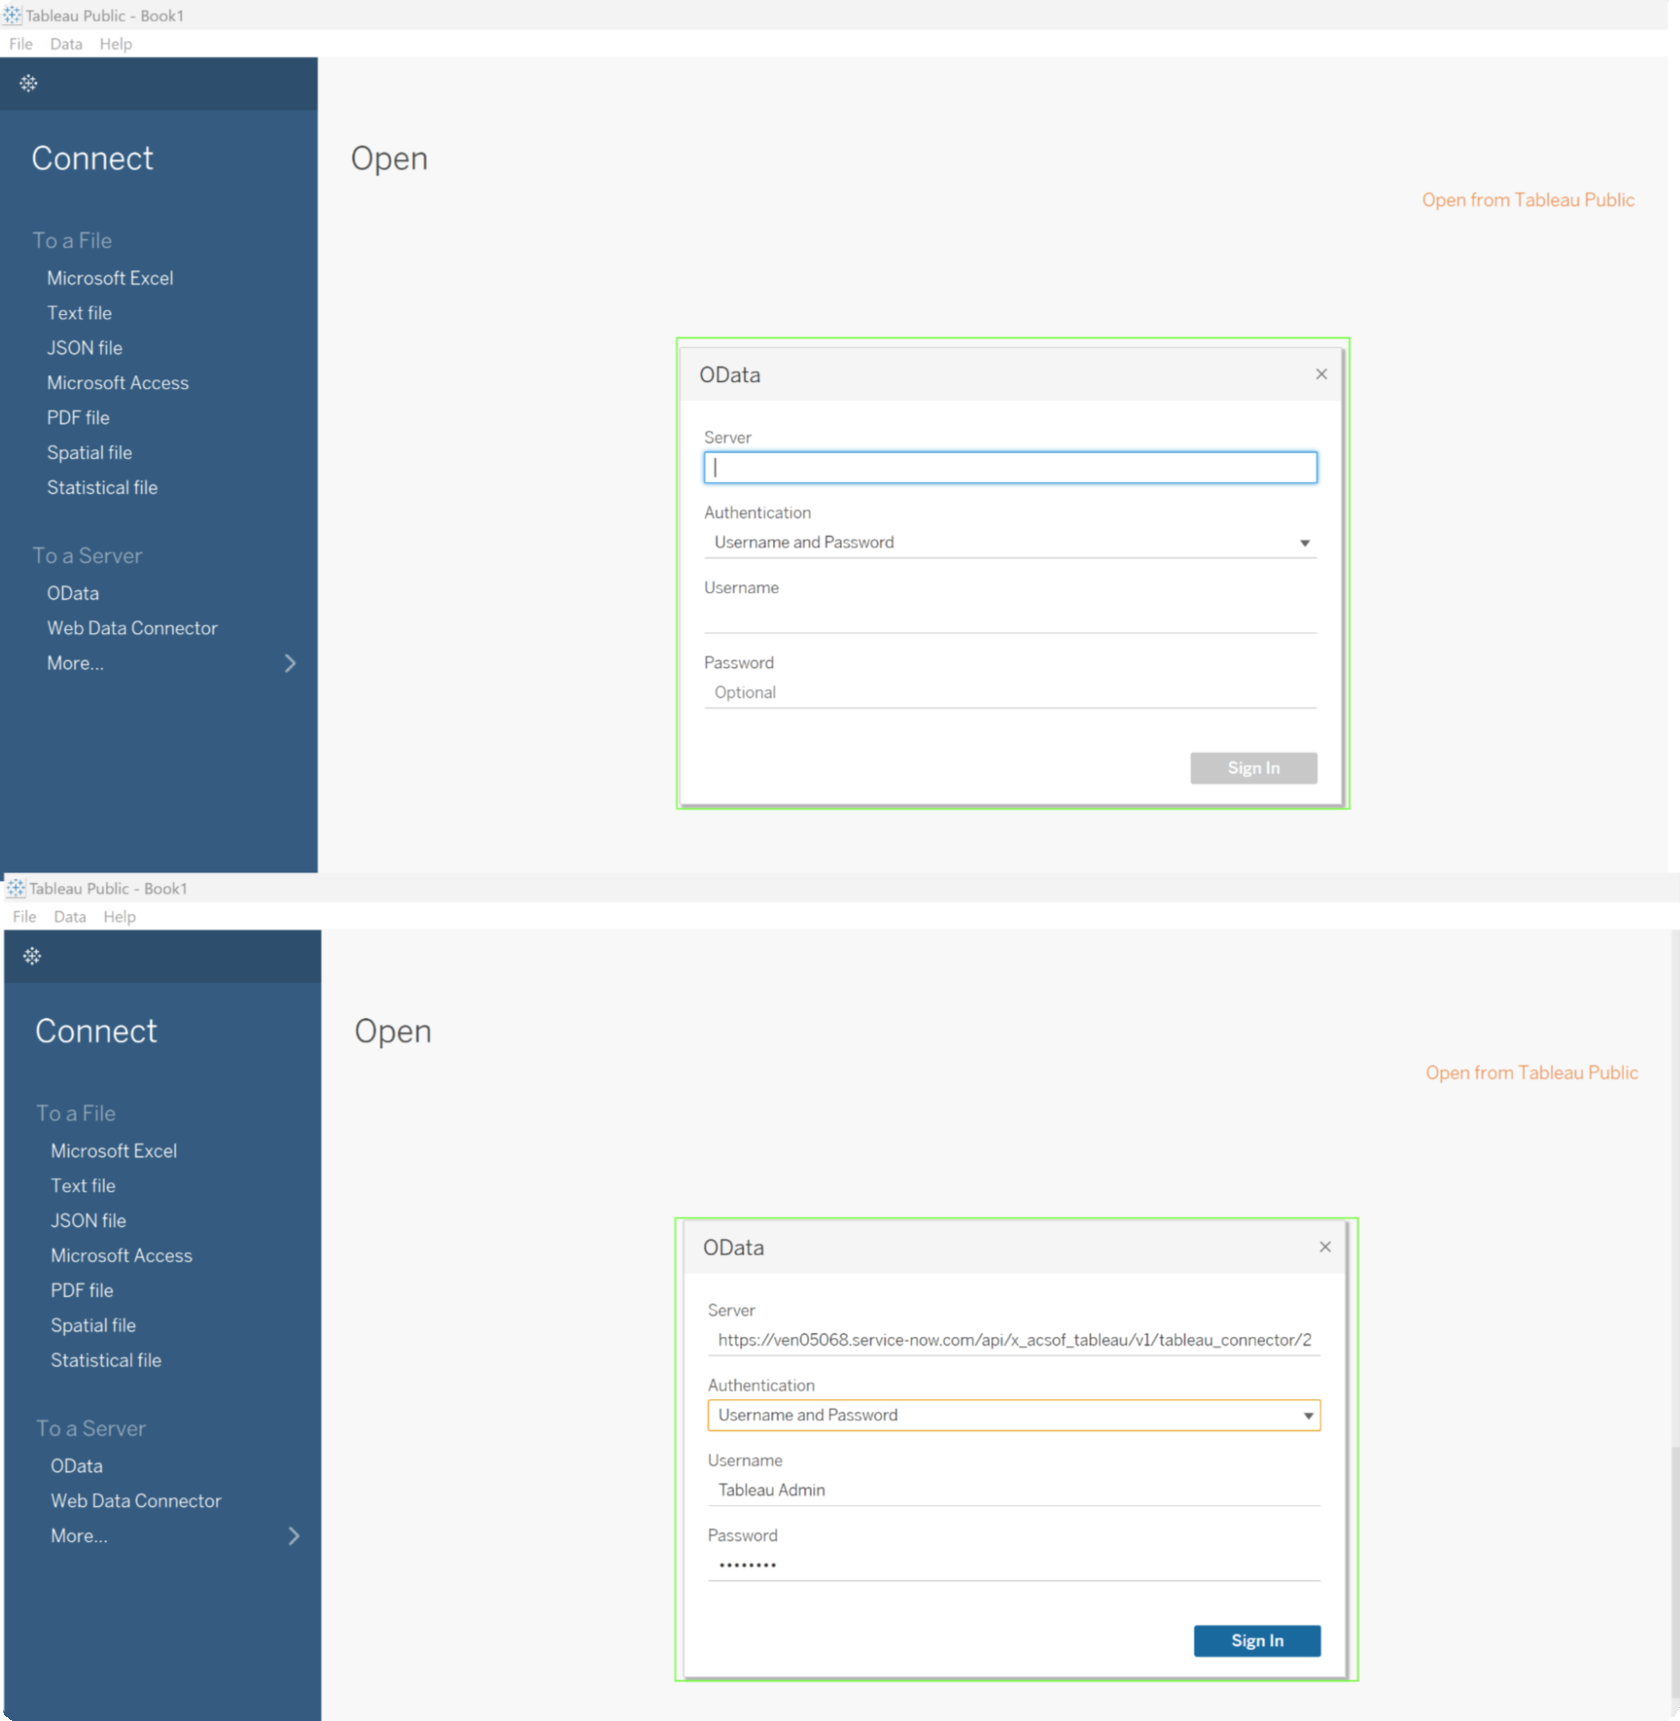
- Open Tableau Desktop, choose “OData,” and enter the copied URL in the Server field.
- Opt for “Username and Password” authentication, input credentials, and click “Sign In.”
- The import process initiates, and upon completion, you can commence building views with the imported ServiceNow data in Tableau.
Recap
Explore the potential of your ServiceNow Database Views, effortlessly exporting data to the leading business intelligence tools for insightful reports and interactive dashboards. Explore the possibilities of dynamic data visualization with our Tableau and Power BI connectors for ServiceNow. Join the conversation by sharing your experiences, questions, and thoughts in the comments below. Connect with us now to elevate your data-driven decision-making!
About acSoft Blog
Harness the transformative potential of ServiceNow with the venerable acSoft blog. As the paragon of ServiceNow expertise, our august platform furnishes an unrivaled repository of insights, tips, and refined methodologies tailored explicitly to fortify your ServiceNow enterprise. Immerse yourself in the acSoft blog for judiciously crafted counsel bespoke to your exigencies.