The traditional static reports and siloed analytics approach is no longer sufficient in the face of increasing complexity and competition; thus, ServiceNow’s solution is Performance Analytics. ServiceNow Performance Analytics empowers organizations to shift seamlessly towards a goal-driven business culture. This integrated application offers user-friendly tools for reporting and analyzing business performance. With over 600 predefined Key Performance Indicators (KPIs) prepared to measure platform processes, Performance Analytics provides responsive, interactive dashboards, advanced drill-downs, and rich analytics. These features offer valuable insights into enhancing the quality of business services and processes.
This article is a comprehensive guide to ServiceNow Performance Analytics, covering its features, benefits, and best practices for enhancing strategic clarity processes.
- What is Performance Analytics in ServiceNow
- ServiceNow Performance Analytics vs Reporting
- ServiceNow Performance Analytics Benefits
- How to Create a Performance Analytics Report in ServiceNow
- ServiceNow Performance Analytics Best Practices
- Recap
What is Performance Analytics in ServiceNow
What is Performance Analytics? ServiceNow Performance Analytics is an in-platform analytics solution, enabling business service owners to track trends and quickly drive continuous improvement within organizations. Its primary function is to facilitate the creation of management dashboards and reports on Key Performance Indicators (KPIs) and metrics. By using the power of Performance Analytics, businesses can gain actionable insights and answers to crucial business questions.
ServiceNow Performance Analytics is designed as a plug-and-play solution, seamlessly integrating with ServiceNow applications and accommodating changes or customizations across the platform. It ensures a fast time-to-value for users, enabling them to leverage rich, secure, real-time data to inform decisions and achieve organizational goals.
Whether optimizing incident management, HR onboarding processes, security incident workflows, customer service trends, CMDB quality, or custom app engagement, Performance Analytics empowers organizations to capitalize on data-driven insights. With its comprehensive features and seamless integration, ServiceNow Performance Analytics enables organizations to harness the full potential of the Now Platform.
Features of ServiceNow Performance Analytics
- Real-Time Visibility: Performance Analytics empowers frontline employees with real-time trend information to enhance request fulfillment and efficiency. In-form analytics allows workers to access context-sensitive data instantly, setting customer expectations and alerting management to potential service breaches.
- Analytics Center: The platform boasts an extensive library of over 600 out-of-the-box KPIs and dashboards for significant business processes, facilitating rapid value delivery. The Analytics Hub automatically tracks Organizational objectives and metrics, where users can drill into results, make annotations, define targets, and receive proactive alerts. The Analytics Hub is accessible via mobile devices, ensuring users can check and analyze trends anytime.
- Interactive Dashboards: Responsive, interactive dashboards provide executives and service owners with graphical insights into performance trends and real-time results, facilitating quick and informed decision-making. These dashboards are highly customizable and intuitive to navigate, with the ability to drill into breakdowns and access underlying operational records. Dashboards can also be shared with groups or individuals to drive operational improvement.
- Trusted Information: Performance Analytics ensures reliance on real-time, in-platform data as the singular source of truth, eliminating the need to navigate disparate information sources. This approach enhances data integrity and accuracy, fostering informed decision-making across the organization.
- Security and Scalability: Organizations can rest assured knowing that Performance Analytics maintains data security and automatically scales to accommodate growth. Consistent permissions management ensures data confidentiality and reliability, safeguarding sensitive information.
- In-Form Analytics: By embedding dashboards and KPIs within existing forms, Performance Analytics streamlines access to insights and enhances decision-making processes. This integration improves user experience and operational efficiency, driving organizational effectiveness.
- Bring-Your-Own Data: Performance Analytics seamlessly integrates in-platform results with external data sources, such as Excel worksheets or JDBC data sources. This capability enables organizations to comprehensively understand performance metrics and trends, facilitating informed decision-making and strategic planning.
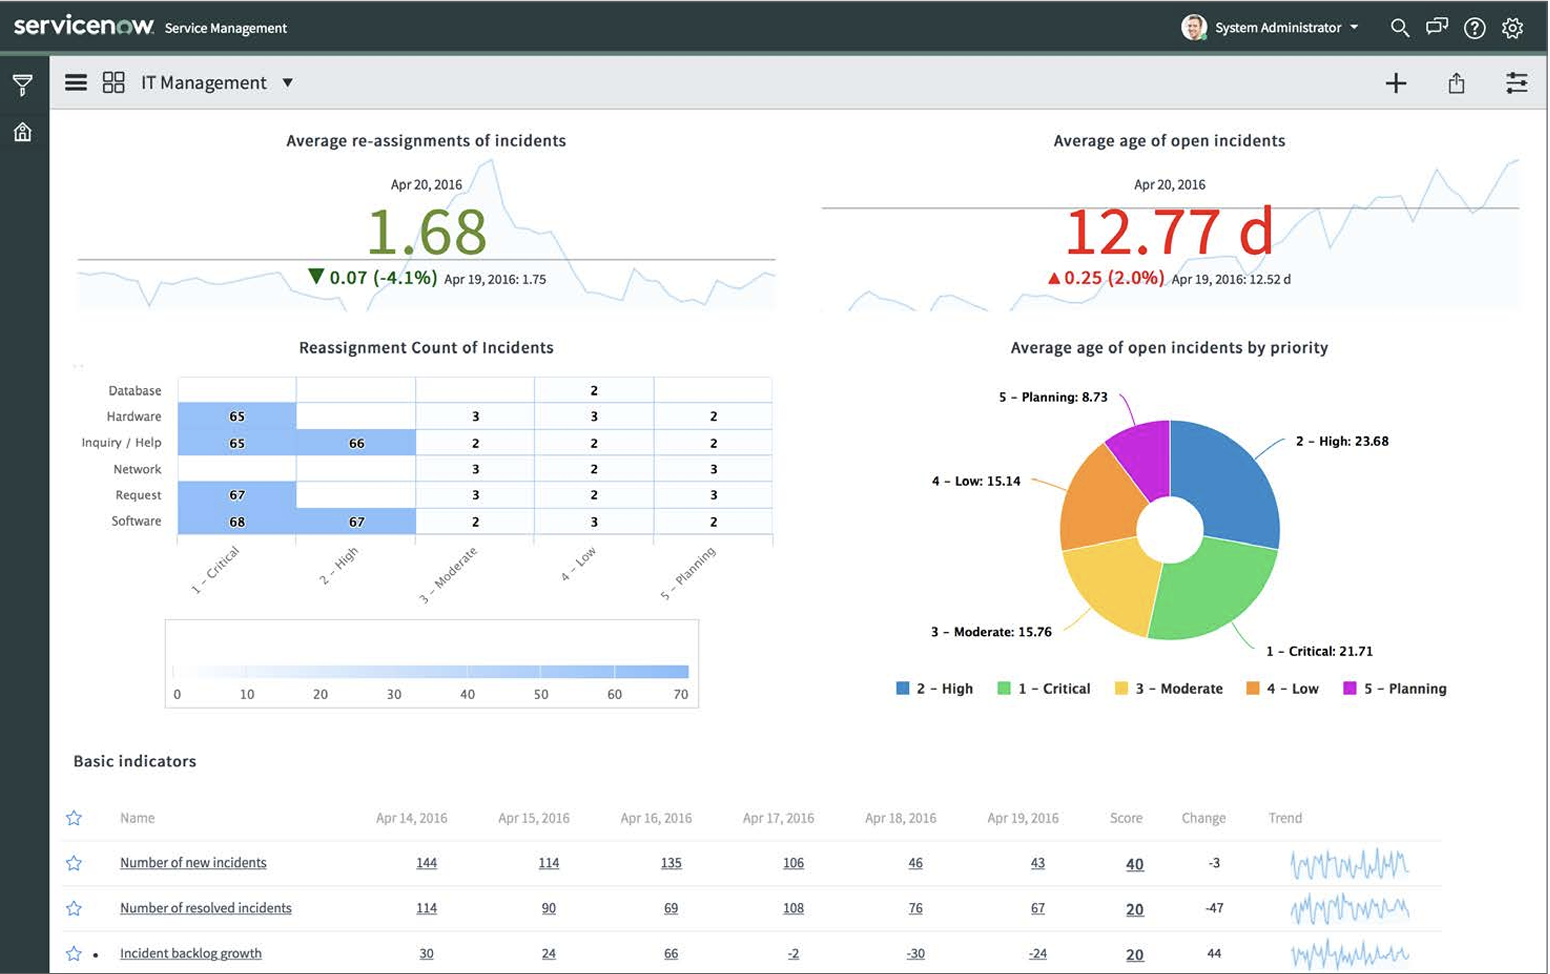
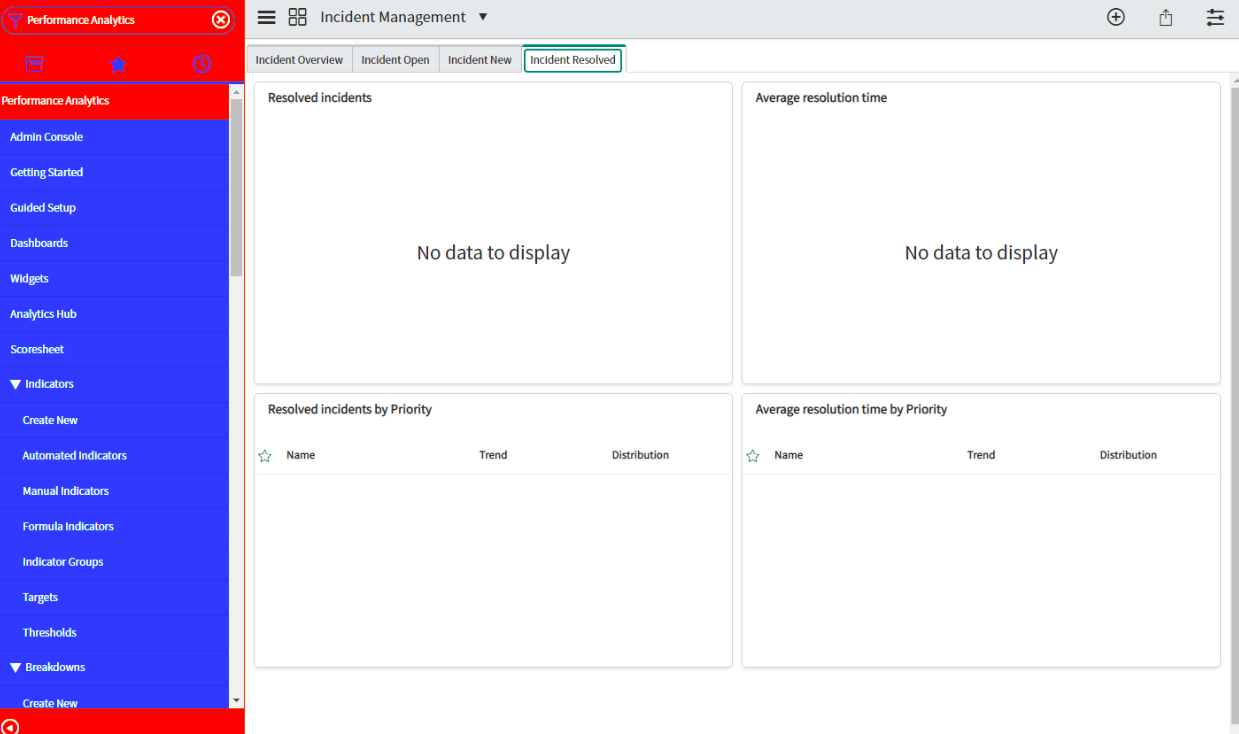
Servicenow Performance Analytics examples.
ServiceNow Performance Analytics vs Reporting
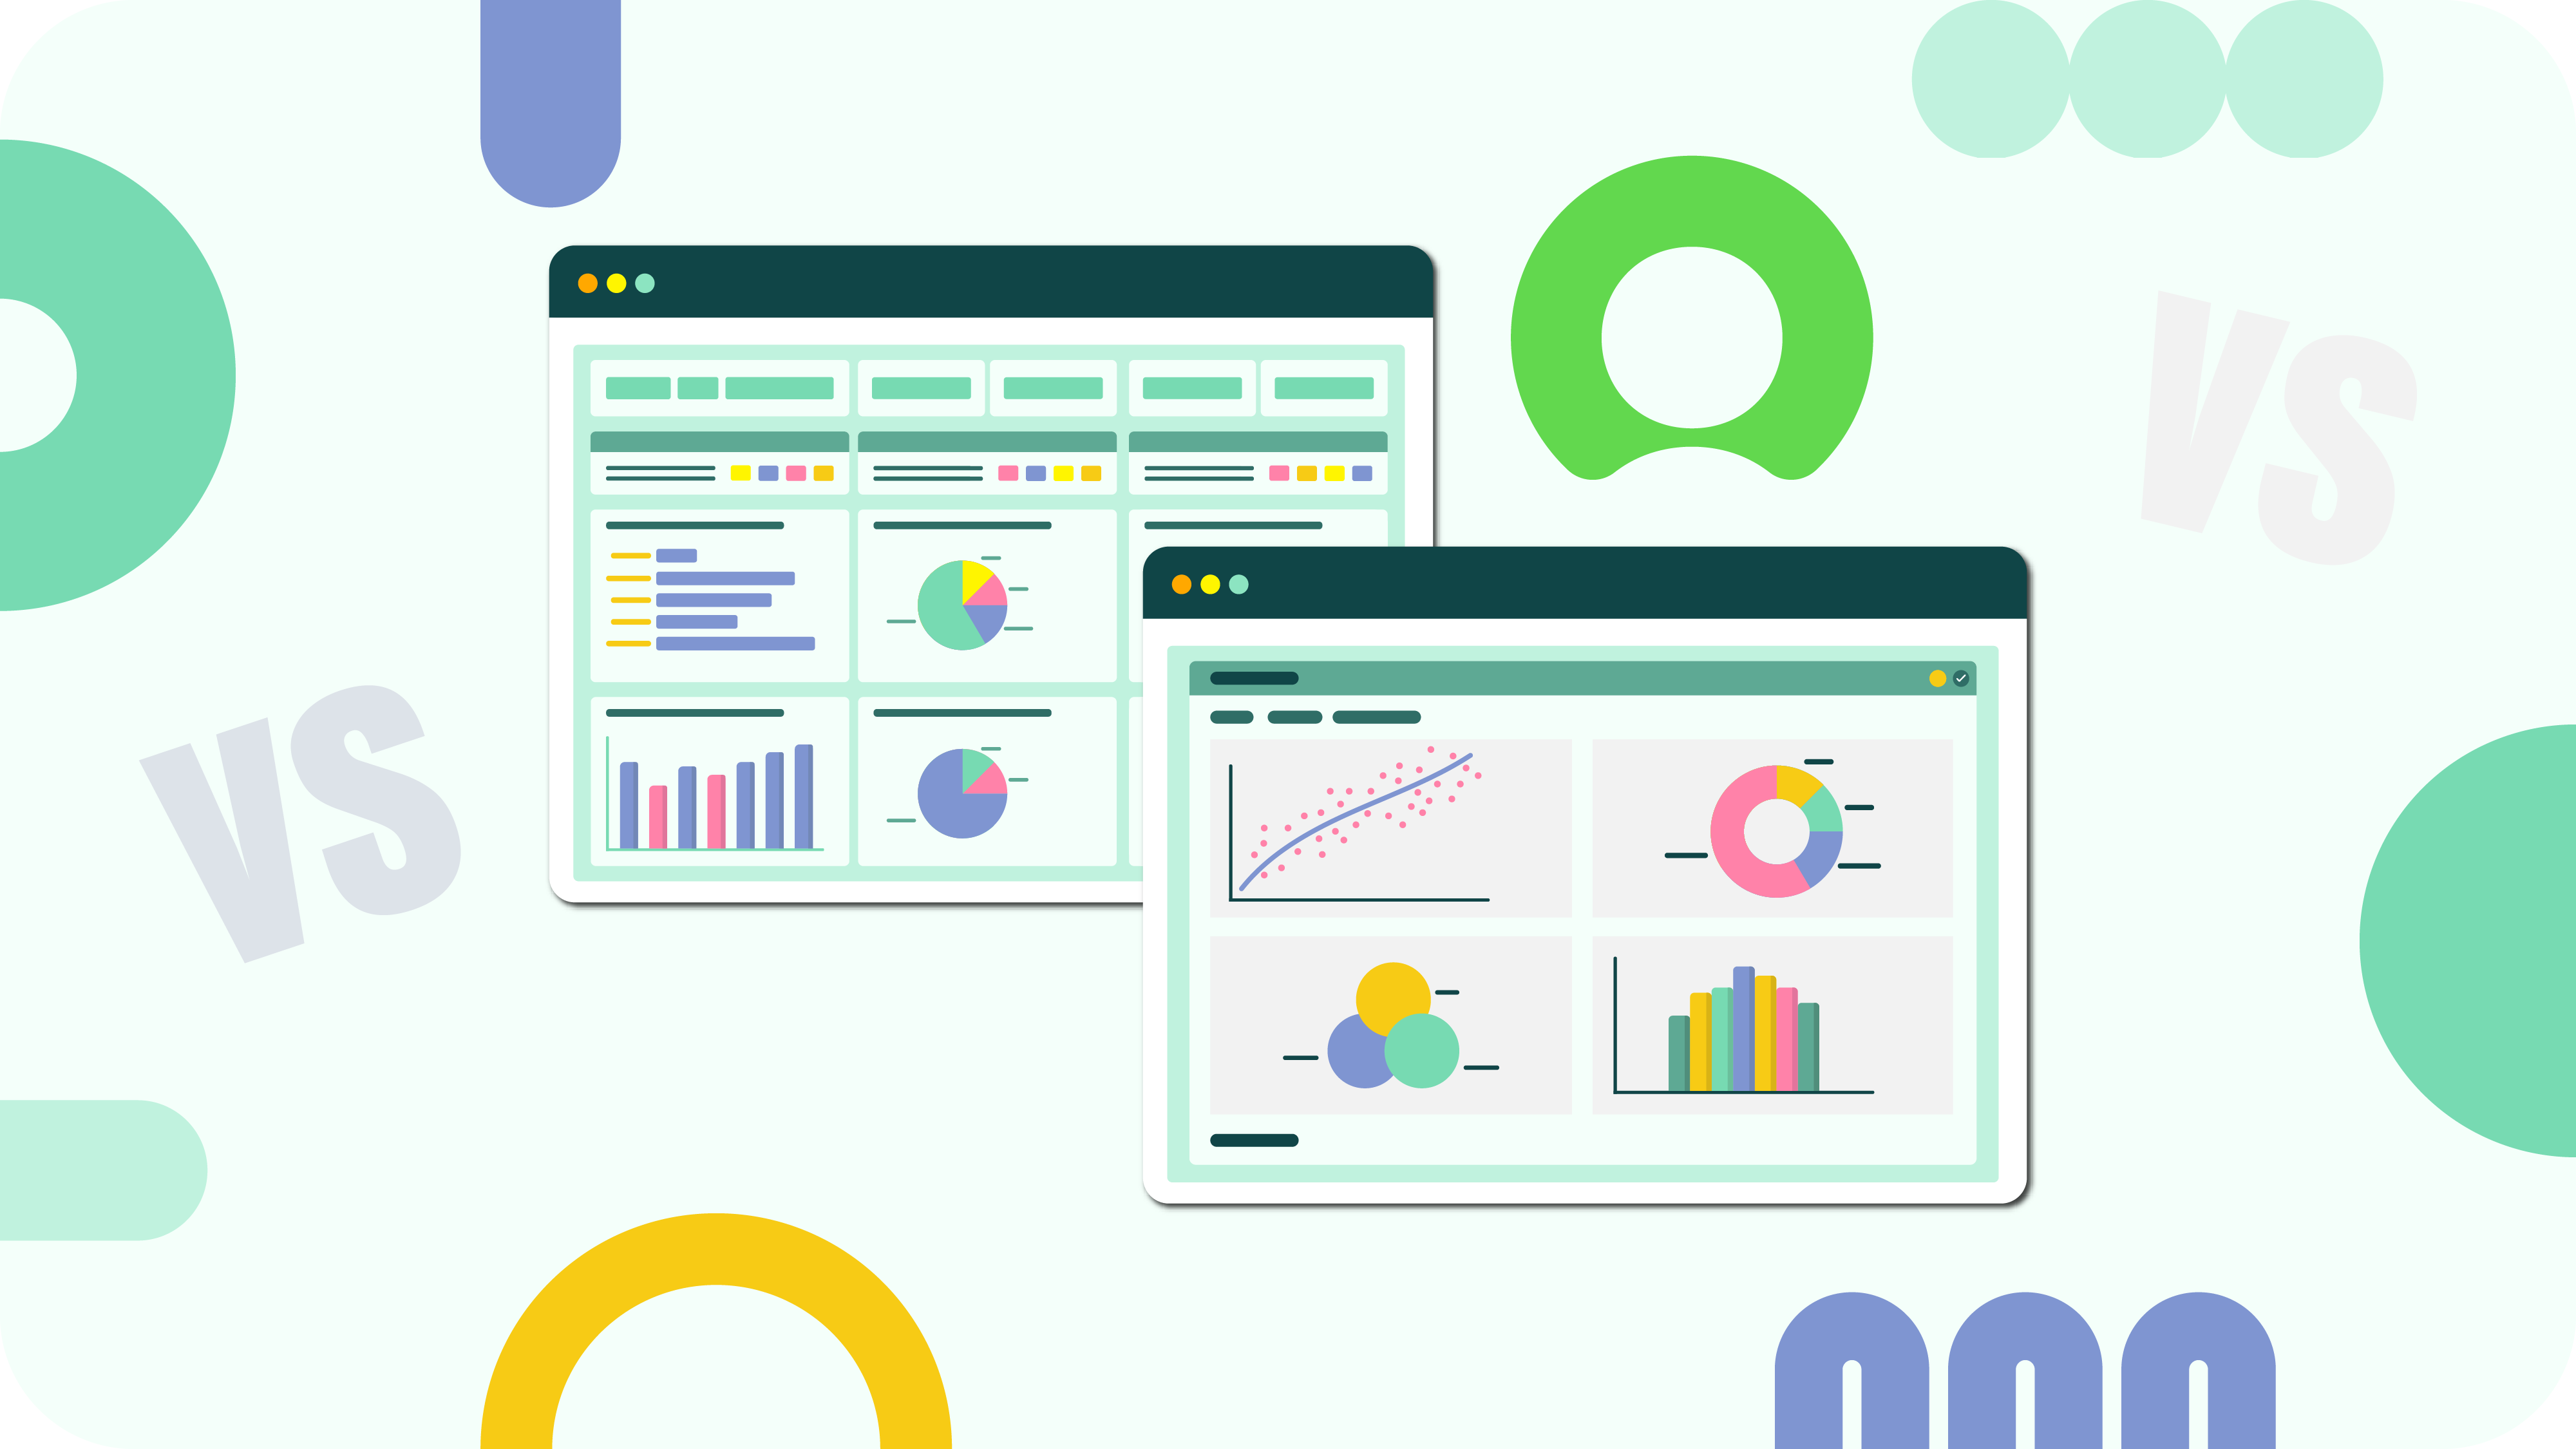
Within the ServiceNow ecosystem, an abundance of data spans every platform facet. Users and customers expect to follow this data presented in a polished format that adds value and comprehensively addresses their inquiries. ServiceNow provides the tools to take advantage of data through Reports and Performance Analytics to add value and comprehensively address users’ inquiries.
ServiceNow Reporting and Performance Analytics serve distinct yet complementary roles within the platform. While both tools offer insights into organizational data, their focus, capabilities, and applications differ. Discerning the difference between reporting vs analytics and the reasonable determination of their applicability to meet customer requirements are crucial steps in preparing a compelling data description.
What sets Performance Analytics vs Reporting apart if they rely on the same data? Reporting acts as the “Where are We Now?” component within the Continual Improvement facet of the Service Value System. When the report is generated, it offers a precise snapshot of the data’s current status. In contrast, Performance Analytics operates within the same “Where are We Now?” domain but extends beyond it to encompass “Where Did We Come From?” and “Where Do We Want To Be?” It provides a more holistic perspective, allowing profound insights into past trends and future objectives.
ServiceNow Performance Analytics:
- Performance Analytics delves deeper into data trends and patterns over time, offering insights into historical and predictive analytics.
- It captures continuous data snapshots to facilitate trend analysis, performance tracking against targets, and forecasting.
- Performance Analytics examples include tracking incident resolution times trends over months or predicting future service demand based on historical data.
- In addition to reporting current states, it enables organizations to monitor KPIs, set thresholds, and gain predictive insights into process improvements.
ServiceNow Reporting:
- Reporting focuses on presenting current data states and is integral to managing records effectively.
- It offers structured reports that provide specific facts about past events, such as the number of open incidents per priority.
- Reporting functionality is readily available for all tables in the ServiceNow platform.
- ServiceNow reports examples include tracking incident volumes over time or monitoring service desk response times.
While Reporting is more suitable for presenting current state facts, Performance Analytics excels in exploring data relationships and providing insights into historical trends and future predictions. Both tools are essential for organizations to gain comprehensive insights into their data and make informed decisions.
If native ServiceNow reporting does not fully meet your analytical requirements, acSoft Inc offers our solution – Power BI and Tableau Connectors for advanced ServiceNow reporting.
Why choose Power BI for ServiceNow reporting? By integrating Power BI with ServiceNow, organizations can exceed the limitations of native ServiceNow reporting, empowering users to visualize ServiceNow data in dynamic dashboards and reports. Power BI offers advanced data modeling and analysis features, including creating complex calculations, performing predictive analytics, and detecting trends. Power BI enables users to share reports and dashboards with colleagues and stakeholders, making it easy to collaborate and make data-driven decisions. With cloud-based deployment, users access reports and dashboards anytime, anywhere.
Why choose Tableau for ServiceNow reporting? Tableau integration with ServiceNow offers interactive dashboards and reports using Tableau’s intuitive drag-and-drop interface, allowing for easy exploration and analysis of ServiceNow data. Tableau’s ability to handle large datasets efficiently allows for faster analysis and better decision-making. Tableau offers powerful analytics capabilities, including predictive analytics, trend analysis, and statistical modeling, empowering users to uncover patterns and trends in their ServiceNow data.
ServiceNow Performance Analytics Benefits
While it is commonly assumed that businesses or organizations are the primary beneficiaries of performance analysis, the scope of its advantages extends far beyond mere financial gains. By leveraging insights derived from performance analysis, organizations can enhance productivity, streamline project execution, and facilitate guided improvements for their members. However, the impact of performance analysis transcends financial metrics, encompassing broader benefits that contribute to operational efficiency, employee satisfaction, and overall organizational success.
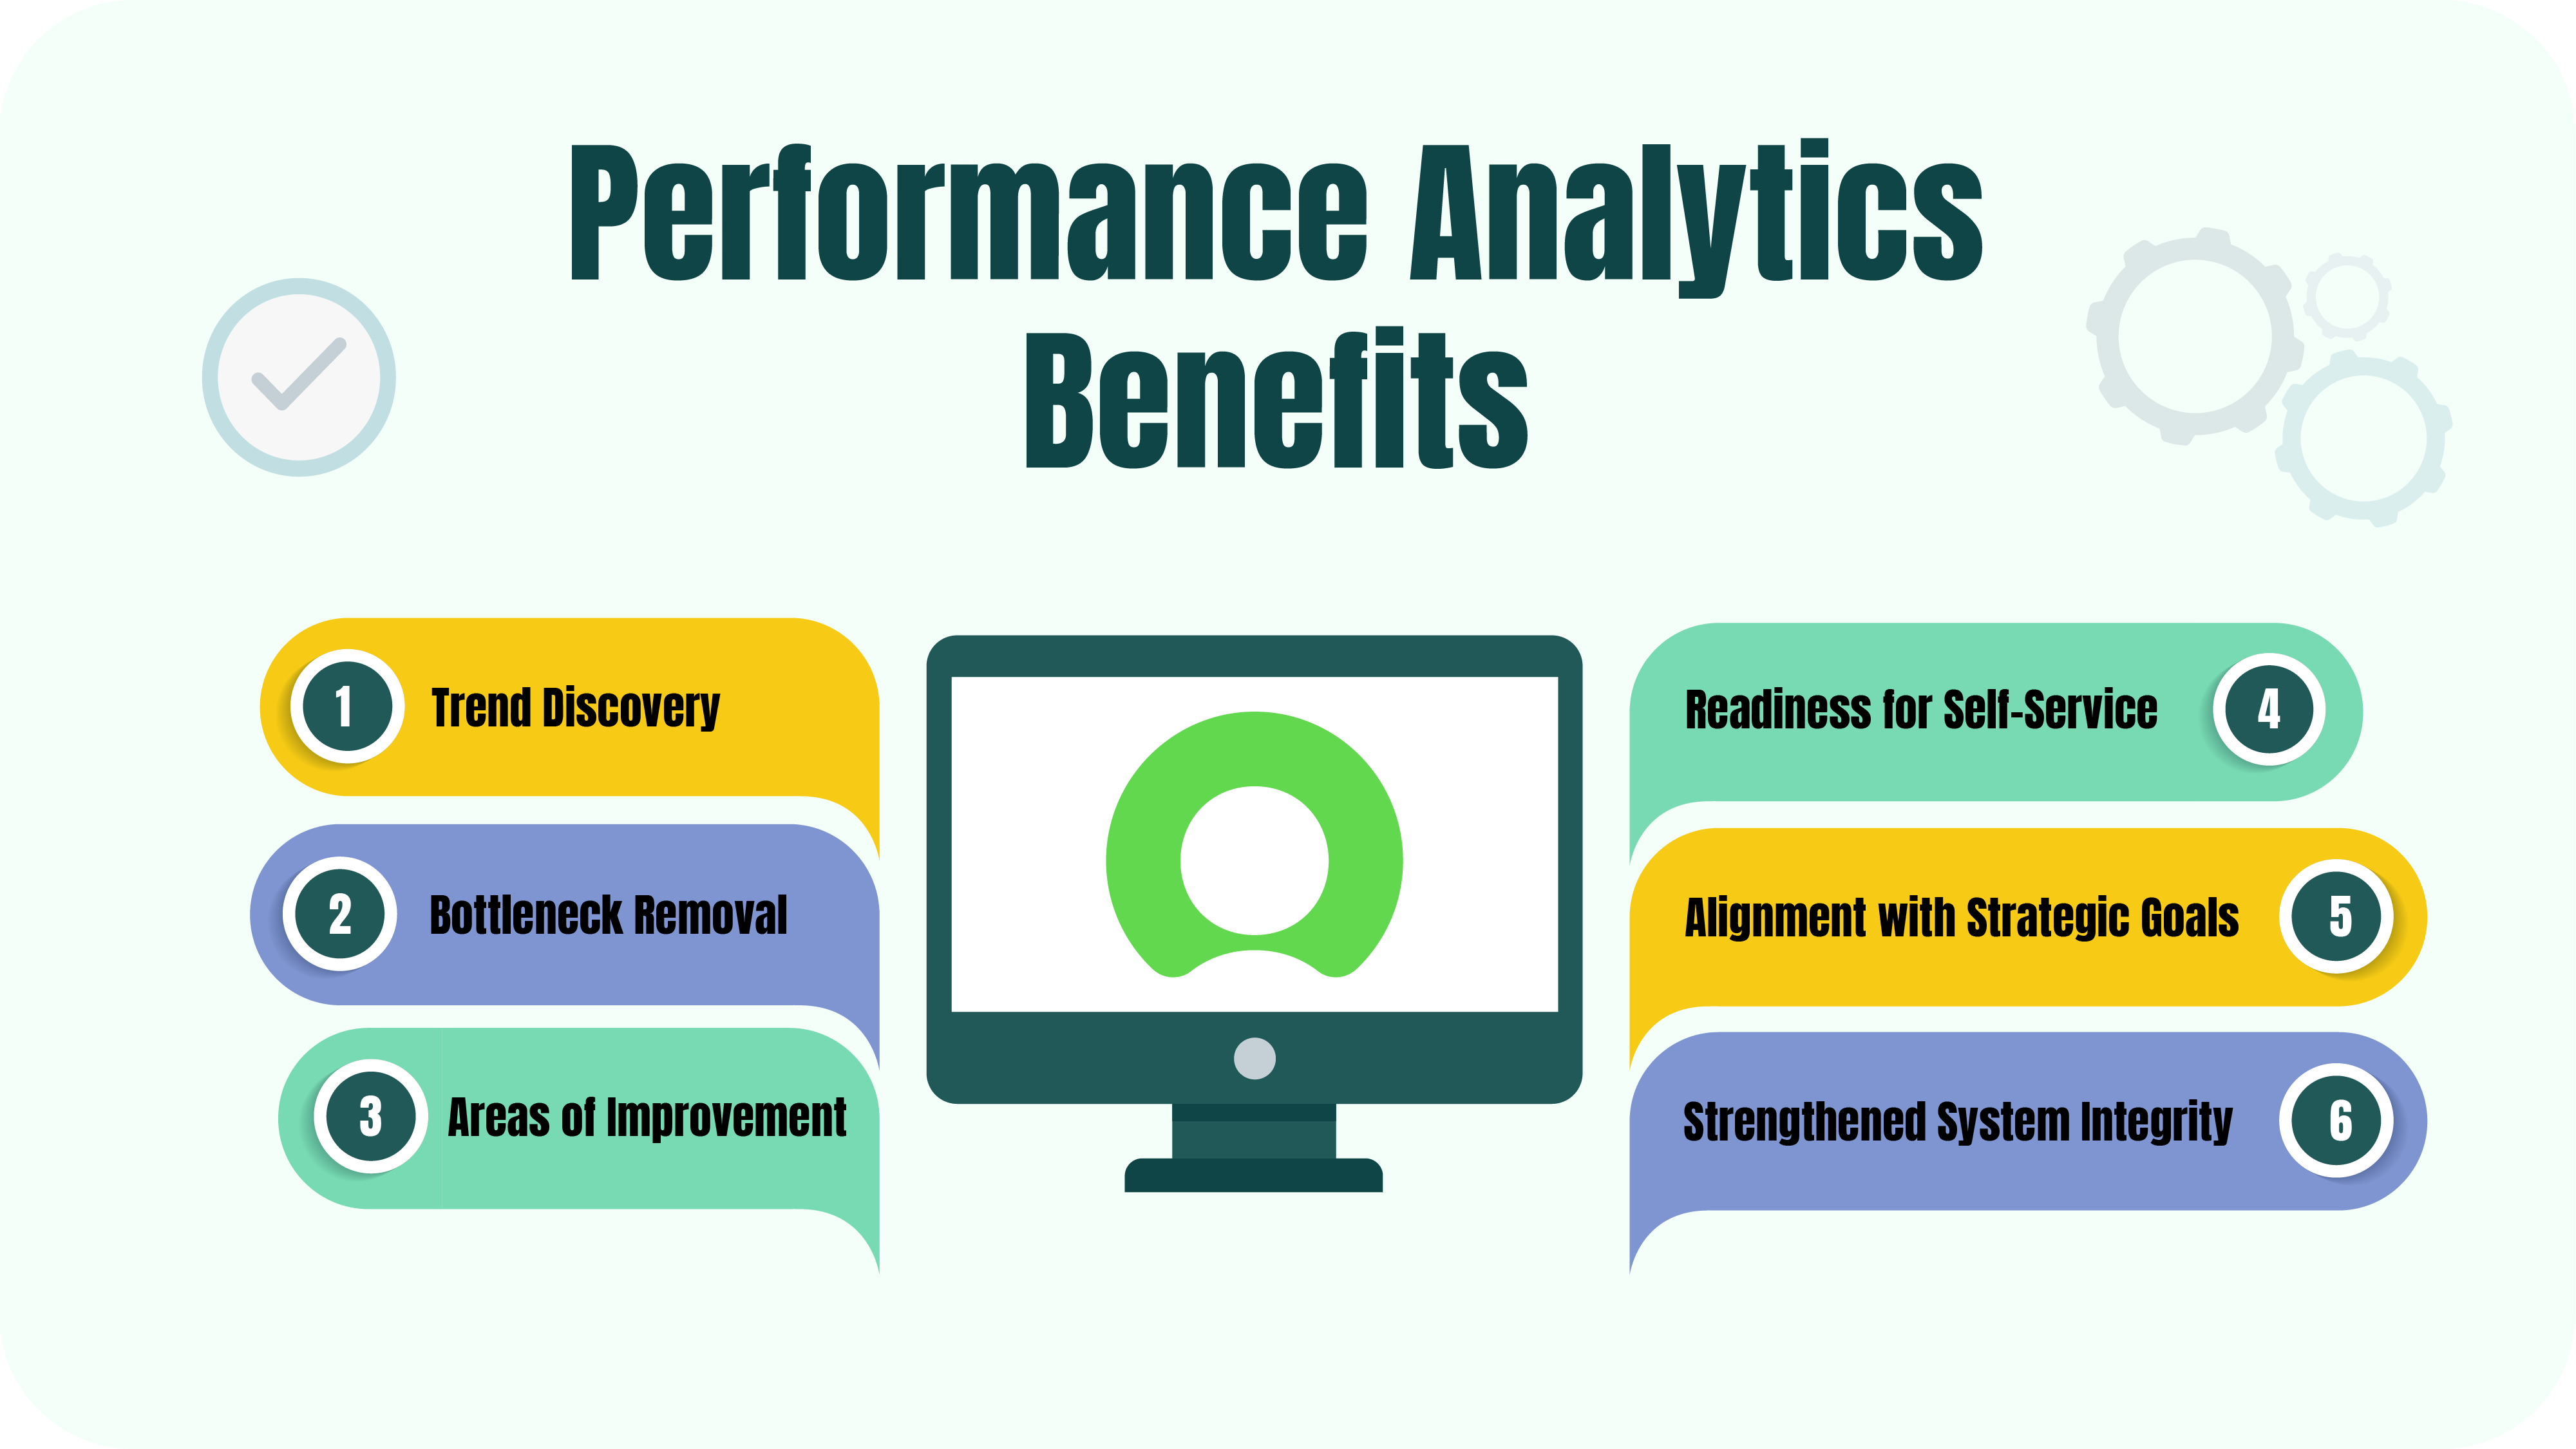
- Trend Discovery
ServiceNow Performance Analytics facilitates trend discovery by analyzing historical data and identifying patterns. By tracking performance metrics over time, organizations can gain valuable insights into emerging trends, allowing them to anticipate changes and make proactive decisions.
- Bottleneck Removal
Performance Analytics helps organizations identify bottlenecks in their processes and operations. By pinpointing areas of inefficiency or congestion, businesses can take corrective action to streamline workflows, eliminate delays, and improve overall efficiency.
- Areas of Improvement
By analyzing performance metrics and identifying areas of underperformance, ServiceNow Performance Analytics enables organizations to prioritize improvement initiatives. Whether it’s enhancing service delivery, optimizing resource allocation, or refining operational processes, businesses can focus on areas with the most significant potential for improvement.
- Readiness for Self-Service
Performance Analytics helps organizations determine which areas are ready for self-service implementation. By analyzing user behavior and satisfaction metrics, businesses can identify opportunities to empower users with self-service capabilities, improving accessibility and efficiency while reducing dependency on manual intervention.
- Alignment with Strategic Goals
ServiceNow Performance Analytics allows organizations to align performance metrics with company strategy, user satisfaction, and operational costs. By setting clear objectives and measuring progress against key performance indicators, businesses can ensure that their activities align with their broader strategic goals, balancing user needs, operational efficiency, and cost-effectiveness.
- Strengthened System Integrity
Performance Analytics strengthens system integrity by providing organizations with accurate and reliable data insights. Businesses can make informed decisions based on trustworthy information by ensuring data consistency and integrity, reducing the risk of errors, inaccuracies, and data discrepancies.
How to Create a Performance Analytics Report in ServiceNow
If you’re new to Performance Analytics reporting in ServiceNow and want to create insightful reports, for example, on incident resolution times, follow these step-by-step instructions. You can navigate the Performance Analytics module and prepare a meaningful report that tracks the time taken to resolve incidents.
Whether you’re analyzing data for incident management improvement or operational efficiency, this guide will easily walk you through the process of how to create a Performance Analytics report in ServiceNow.
- Ensure you can access the “Incident Management” Performance Analytics Dashboard or a similar dashboard with relevant incident resolution data.
- Log in to your ServiceNow instance using your credentials.
- Navigate to the Performance Analytics module.
- Click on the “Reports” tab to access the report creation interface.
- Click on the “New” button to start creating a new report.
- Choose the appropriate report type for your analysis. In this case, select “Time Series” as the report type.
- Provide a clear and descriptive name for your report that reflects its purpose, such as “Incident Resolution Time Analysis.”
- Write a short description explaining the report’s focus, such as “This report displays the average time taken to resolve incidents over time.”
- Define the filters for your report to narrow down the data displayed. For instance, add a filter for the incident resolution time field and set the condition to “Resolution Time is not empty.”
- Customize the layout and appearance of your report to make it visually appealing and easy to interpret. You can adjust the chart type, color scheme, and labeling as needed.
- Preview the report to ensure it displays the desired data accurately.
- Once satisfied, save the report and specify the appropriate access permissions to make it available to your organization’s desired users or groups.
ServiceNow Performance Analytics Best Practices

To maximize the effectiveness of ServiceNow Performance Analytics, it’s essential to adhere to a set of best practices that ensure accurate insights and efficient platform utilization. Here are some key guidelines to follow:
- Define Clear Objectives: Establish clear goals and objectives for your analytics initiatives, focusing on key performance indicators (KPIs) that align with organizational priorities.
- Start with Essential Indicators: Avoid overwhelming your team by starting with a few critical indicators that directly support your objectives. Gradually expand your analytics scope as needed.
- Engage Stakeholders: Involve stakeholders from different departments and levels to ensure that analytics efforts address their specific reporting needs and contribute to organizational goals.
- Utilize Breakdowns: Take advantage of breakdowns to analyze data from different perspectives and gain deeper insights into performance trends. Use breakdown elements to segment data effectively.
- Implement Data Governance: Establish robust processes to maintain data quality, integrity, and security. Regularly monitor data sources to ensure accuracy and reliability.
- Create Interactive Dashboards: Develop interactive dashboards that allow users to explore data dynamically and drill down into specific details. Enhance the user experience by designing intuitive and visually appealing dashboards.
- Automate Updates: Schedule automatic updates for indicators and dashboards to ensure users can access the latest information without manual intervention.
- Collaborate Across Teams: Foster collaboration among cross-functional teams to gain a comprehensive view of organizational performance and facilitate data-driven decision-making.
- Optimize Indicator Design: Design indicators with performance and efficiency in mind, avoiding unnecessary complexity that could impact loading times. Regularly review and refine indicators to improve effectiveness.
- Share Best Practices: Encourage knowledge sharing among users to promote the adoption and usage of Performance Analytics. Share success stories and best practices to inspire others and drive continuous improvement.
- Provide Training and Support: Offer comprehensive training sessions and ongoing support to users, especially those new to Performance Analytics. Ensure that users have the skills and resources to leverage the platform effectively.
- Stay Updated with New Features: Stay informed about new features and enhancements introduced in ServiceNow Performance Analytics. Continuously explore new capabilities to leverage the latest advancements in analytics technology.
By following these best practices, organizations can harness the full potential of ServiceNow Performance Analytics to drive informed decision-making, improve operational efficiency, and achieve strategic objectives effectively.
Recap
ServiceNow Performance Analytics offers a comprehensive solution for organizations leveraging data-driven insights to enhance performance and drive business success. By implementing best practices and utilizing the robust features of Performance Analytics in ServiceNow, organizations can gain valuable visibility into their operations, identify areas for improvement, and make informed decisions to achieve strategic objectives. From defining clear goals and engaging stakeholders to creating interactive dashboards and providing ongoing training and support, ServiceNow Performance Analytics empowers organizations to optimize their performance management processes effectively.
About acSoft Blog
acSoft Blog is where you’ll find a treasure trove of invaluable insights tailored for ServiceNow enthusiasts. As a premier ServiceNow Build Partner boasting certified apps in the esteemed ServiceNow Store, acSoft Inc. stands at the forefront of ServiceNow expertise. Our blog is dedicated to delivering comprehensive knowledge, expert advice, and practical tips to help you navigate the vast landscape of the ServiceNow platform. Crafted by seasoned professionals deeply entrenched in the ServiceNow community, our content is your ultimate resource for staying informed, empowered, and ahead of the curve in all things ServiceNow.